ABSTRACT
The objective of this systematic review and meta-analysis of observational studies was to estimate the prevalence of residual alterations in the lung parenchyma on computed tomography (CT) after coronavirus disease 2019 (COVID-19), correlating those alterations with the severity of the acute phase of the disease. We reviewed data related to adult patients evaluated at 3, 6, and 12 months after the diagnosis of moderate-to-critical COVID-19. We performed structured searches of 14 databases, encompassing works published between January 2020 and January 2024. Thus, 44 primary studies were selected. Data on mild cases of COVID-19 were excluded, as were those related to assessment of the acute phase of the disease. The results were analyzed descriptively, and meta-analyses were conducted to estimate prevalence. The estimated prevalence of altered CT scans at post-diagnosis months 3, 6, and 12 was 69.0% (95% CI: 60.0–77.6%; I2 = 86%; p < 0.001), 62.0% (95% CI: 52.0–71.5%; I2 = 77%; p < 0.001), and 54.0% (95% CI: 40.0–67.5%; I2 = 88%; p < 0.001), respectively. There was no correlation between severity of the acute phase and the persistence of alterations on CT in general. Among the CT scans acquired at post-diagnosis month 3, alterations indicative of fibrosis were observed in 22% (95% CI: 13–30%; I2 = 85%; p < 0.001), and no reduction in that prevalence was observed at the subsequent time points (rho-s = 0.952; p < 0.000). The severity of the acute phase showed a positive correlation with the presence of lesions indicative of pulmonary fibrosis on CT scans acquired at 3 months after the diagnosis of COVID-19.
Keywords:
COVID-19; Tomography, X-ray computed; Post-acute COVID-19 syndrome; Thorax; Lung diseases/complications.
RESUMO
Trata-se de uma revisão sistemática com metanálise de estudos observacionais, com o objetivo de estimar a prevalência de alterações tomográficas residuais no parênquima pulmonar, em correlação com a gravidade da doença aguda. Foram observados os marcos temporais 3, 6 e 12 meses após o diagnóstico de COVID-19 moderada a crítica em adultos. Foi feita busca estruturada em 14 bases de dados, englobando trabalhos publicados de janeiro/2020 a janeiro/2024, selecionando-se 44 estudos primários. Dados sobre casos leves de COVID-19 e avaliação da fase aguda da doença foram excluídos. Os resultados foram analisados descritivamente e metanálises foram conduzidas para derivar estimativas de prevalência. A prevalência estimada de tomografias alteradas foi 69% (IC 95%: 60–77,6%; I2 = 86%; p < 0,001) aos 3 meses; 62% (IC 95%: 52–71,5%; I2 = 77%; p < 0,001) aos 6 meses; e 54% (IC 95%: 40–67,5%; I2 = 88%; p < 0,001) aos 12 meses. Não houve correlação entre gravidade da fase aguda e persistência de lesões tomográficas gerais. Em 22% (IC 95%: 13–30%; I2 = 85%; p < 0,001) das tomografias de 3 meses foram observados indicativos de fibrose, sem redução da prevalência nos controles subsequentes (ρs = 0,952; p < 0,000). A gravidade da fase aguda apresentou correlação positiva com a presença de lesões tomográficas indicativas de fibrose pulmonar aos 3 meses após COVID-19.
Palavras-chave:
COVID-19; Tomografia computadorizada; Síndrome pós-COVID-19; Tórax; Doença pulmonar crônica.
INTRODUCTION
Post-acute coronavirus disease 2019 (post-acute COVID-19) syndrome is characterized by new or persistent symptoms, unexplained by another diagnosis, for more than 12 weeks after an infection consistent with COVID-19(1). Although the extent of lung lesions in the acute phase is considered a risk factor, mild acute symptoms can also evolve to post-acute COVID-19 syndrome(2. The progression of the disease has been monitored in various studies. One example is the multicenter COVID-FIBROTIC cohort study(3), whose participants presented with a range of imaging characteristics on computed tomography (CT) at one year after diagnosis with COVID-19, including complete resolution (in 63.0%) and chronic fibrotic changes (in 29.4%). The distinction between a slowly resolving inflammatory process and potentially irreversible lesions can be made by analyzing the temporal behavior of lung lesions on chest CT.
In the context outlined above and in the interest of evidence-based health care, a systematic review can synthesize the knowledge currently available in the scientific literature. Such a study design combines the results of various primary studies, increasing the sample size and the statistical power of the results. Therefore, to estimate the prevalence of residual CT alterations in the lung parenchyma, in correlation with the severity of the acute phase of the disease, we conducted a systematic review and meta-analysis of observational studies. We synthesized data related to adult patients evaluated at 3, 6, and 12 months after the diagnosis of moderate-to-severe COVID-19.
METHOD
This systematic review was conducted in accordance with the Preferred Reporting Items for Systematic Review and Meta-Analysis (PRISMA) guidelines and was registered with the International Prospective Register of Systematic Reviews(4) (Registration no. CRD42024572100).
The study question was formulated by using the Population Exposure Comparator Outcome framework, through which we defined the population as adults; the exposure as a confirmed case of moderate to critical acute COVID-19 requiring hospitalization, at least 3 months prior to the CT scan; the comparator as a normal chest CT scan; and the outcome as residual lung changes. The search strategy involved the following keywords (based on the Medical Subject Headings and Excerpta Medica Tree): “adult”; “SARS-CoV-2”; “COVID-19”; “long COVID”; “tomography”; “pulmonary fibrosis”; and “chronic interstitial lung disease”. In addition to the inclusion criteria described in the Population-Exposure-Comparator-Outcome framework, the selection of full texts included randomized or non-randomized observational studies, either cohort studies or case-control studies. Studies evaluating mild cases of COVID-19 were excluded, as were those assessing only the acute phase of the disease. The characteristics of the CT findings were described in accordance with the Fleischner Society glossary of terms for CT imaging. Statistical analysis was performed with the Statistical Package for the Social Sciences, version 3.0 (SPSS Inc., Chicago, IL, USA).
A structured search was conducted between 17 January and 20 January, 2024, in 14 databases, including research protocols, unpublished data sources, and gray literature: Embase; Brazilian Virtual Library of Health (Latin-American and Caribbean Health Sciences Literature); Medline/PubMed; Scopus (Elsevier); Web of Science; Cochrane and the Cochrane Database for COVID-19 Studies; ProQuest Dissertations; International Standard Randomised Controlled Trial Number Registry; ClinicalTrials.gov; Brazilian Registry of Clinical Trials; European Union Clinical Trial Register; University of London; and Google Scholar. There were no restrictions on the language of publication. Studies published from January 2020 through January 2024 were included. Two of the authors, working independently, identified eligible texts. In case of disagreement, a third author was consulted. The data were extracted into standardized tables. We extracted data on the characteristics of the primary studies and their study populations, as well as on the lung alterations described on chest CT scans and the use of artificial intelligence (AI) in the CT assessment process. The primary outcome measure was the prevalence of CT alterations in the lung parenchyma at 3, 6, and 12 months after the diagnosis of COVID-19. Those time points were defined based on those most commonly evaluated in the primary studies included. In addition, they allow observation of the radiological evolution in distinct phases of recovery: early convalescence (3 months); the intermediate phase (6 months); and the late/potential sequelae phase (12 months).
Categorical variables are reported as absolute values and percentages, whereas continuous variables are reported as means and standard deviations. Summary measures for the pooled prevalence estimates of the primary outcome measure were calculated by meta-analysis under a random-effects model and are presented as forest plots. The certainty level for inferences was 95%. Comparisons between the mean prevalence of each CT alteration at each time point were made with the paired-samples t-test (t) for variables with normal data distribution or with the Wilcoxon signed-rank test (Z) for those with nonparametric distribution. Spearman’s correlation coefficient (rho-s) was calculated to assess the correlation between the prevalence of a given CT alteration and the severity of the acute phase of COVID-19, the correlation being considered significant at the 0.05 level, for both ends. Statistical heterogeneity was assessed by using the Higgins test to calculate the I2 statistic, on the basis of which, the heterogeneity was classified as low (I2 < 50%) or high (I2 > 50%), and a qualitative analysis was performed to determine the dispersion of the sample data. Subgroup analyses were performed according to the outcomes and levels of severity evaluated. The methodological quality of primary studies was assessed by using the Newcastle-Ottawa scale for observational studies, and publication bias was analyzed by using funnel plots and Egger’s test.
RESULTS
General characteristics of primary studies
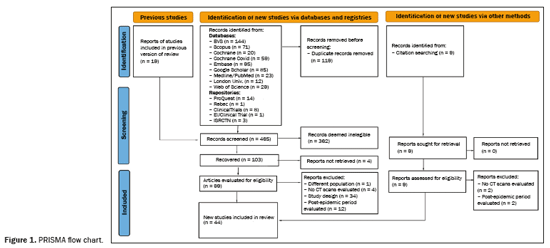
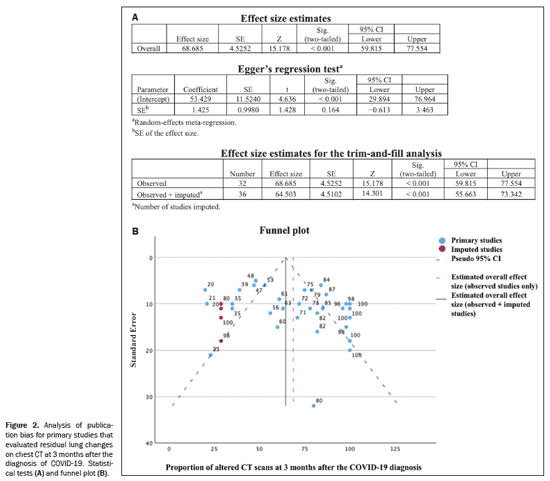
A total of 565 articles were retrieved via the search strategy. From among those, 44 primary studies were selected (Figure 1), including cohort studies (n = 38) and case-control studies (n = 6). Of those 44 studies, 31 were prospective and 13 were retrospective. The methodological quality was considered good, with a score of 7 or 8 on the Newcastle-Ottawa scale, in 34 of the studies and fair in the others(5–14). No significant publication bias was observed in the sample for the various outcomes (Egger p > 0.05), as illustrated in Figure 2. The countries with the highest numbers of articles were China (n = 12) and Italy (n = 9). In three studies, a low-dose radiation protocol was employed for chest CT (Table 1). Nine studies used AI to aid in the identification and quantification of CT lesions. Table 2 lists the AI-based programs used and correlates them with the countries where the studies were conducted. The various types of image interpretation software were designed to identify normal lung parenchyma or to recognize diseases in the parenchyma(15,16).
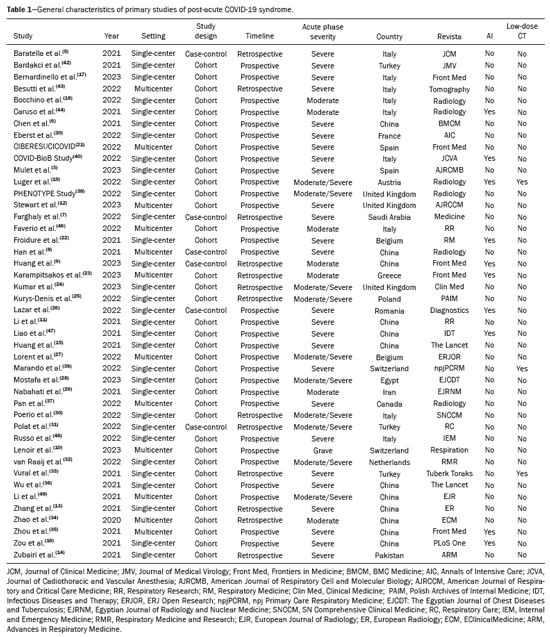

Among the 44 studies selected, 32 (72.7%), 19 (43.2%), and 21 (47.7%), respectively, reported CT findings obtained at 3 months
(5,6,10–14,16–40), 6 months
(3,6,7,9,11, 15,18,19,23,29,31,32,36,37,41–45), and 12 months
(6–8,10,11,15,17–20, 24,27,32,36–41,43,46) after the COVID-19 diagnosis. Six studies (13.6%) reported CT findings obtained at all three time points
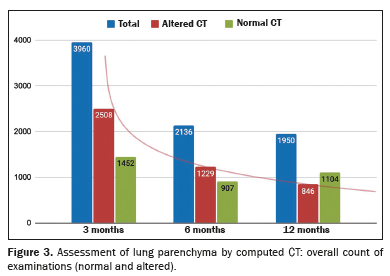
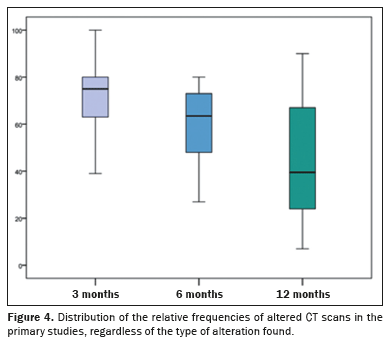
(6,18,19,36,37,41). Collectively, the 44 studies evaluated 8,046 CT scans acquired in 5,776 participants, given that some participants were evaluated at more than one time point. Of those 5,776 participants, 59% of were men and 41% were women; the mean age was 57 ± 8 years; the acute phase of COVID-19 was classified as severe/critical in 71% of the participants and as moderate in 29%. Figure 3 illustrates the numbers of CT examinations categorized by time point and finding. Figure 4 shows the distribution of the relative frequencies of altered CT scans.
Combined CT findings: meta-analysisThe prevalence of residual lesions in the lung parenchyma was defined as the ratio between the number of CT scans showing any alteration and the total number of CT scans available in the period defined. The results of the meta-analyses are detailed in the forest plots displayed in Figures 5, 6, and 7.
The pooled prevalence of residual lesions on 3-month CT scans estimated in the meta-analysis was 69% (95% CI: 60.0–77.6%;
I2 = 86%;
p < 0.001). That meta-analysis included data from 32 studies involving 3,960 participants. In that sample, the prevalence ranged from 20%
(17) to 100%
(10,14,18,26,38). The meta-analysis stratified by the severity of the acute phase of COVID-19 resulted in an estimated pooled prevalence of 68.5% (95% CI: 56.0–81.0%) in the group in which it was classified as severe and 83% (95% CI: 72–94%) in the group in which it was classified as moderate.
The pooled prevalence of at least one lesion seen on the 6-month CT scan, estimated in the meta-analysis, was 62.0% (95% CI: 52.0–71.5%;
I2 = 77%;
p < 0.001). In that sample, the prevalence ranged from 18%
(23) to 80%
(6). That meta-analysis included data from 19 studies involving 2,136 participants. The meta-analysis stratified by the severity of the acute phase of COVID-19 resulted in an estimated pooled prevalence of 62.0% (95% CI: 49.0–74.0%) in the group in which it was classified as severe and 60.0% (95% CI: 34.0–86.5%) in the group in which it was classified as moderate.
The pooled prevalence of at least one lesion seen on the 12-month CT scan, estimated in the meta-analysis, was 54.0% (95% CI: 40.0–67.5%;
I2 = 88%;
p < 0.001). In that sample, the prevalence ranged from 7%
(17,18) to 80%
(39). That meta-analysis included data from 21 studies involving 1,950 participants. The meta-analysis stratified by the severity of the acute phase of COVID-19 resulted in an estimated pooled prevalence of 55.5% (95% CI: 36.0–75.0%) in the group in which it was classified as severe and of 37.0% (95% CI: 0.0–95.0%) in the group in which it was classified as moderate.
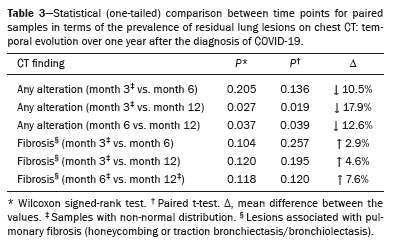
The rate of reduction in the prevalence of altered CT scans was calculated in order to assess the temporal evolution over a one-year period after the diagnosis of COVID-19 (Table 3). There was a statistically significant reduction in the mean prevalence of residual lesions on CT scans between post-diagnosis months 3 and 12, as well as between post-diagnosis months 6 and 12, with reductions of 18% (Z = −1,922;
p = 0.027) and 13% (t(9) = 1,990;
p = 0.039), respectively. There was no significant reduction in the prevalence of such lesions between post-diagnosis months 3 and 6 (Z = 1.26;
p = 0.208).
CT findings suggestive of fibrosis: meta-analysisVarious CT findings were classified by primary studies as lesions related to pulmonary fibrosis. The most commonly described findings were honeycombing and traction bronchiectasis. A meta-analysis of the prevalence of this subgroup demonstrated wide data dispersion (Figure 8; Table 3). For this review, the presence of honeycombing or traction bronchiectasis was considered indicative of fibrosis.
The estimated pooled prevalence of pulmonary fibrosis at 3, 6, and 12 months after the COVID-19 diagnosis was 22% (95% CI: 13–30%;
I2 = 85%;
p < 0.001), 23% (95% CI: 10–35;
I2 = 87%;
p < 0.001), and 24% (95% CI: 10–37.5%;
I2 = 88%;
p < 0.001), respectively. There was no significant reduction in fibrosis prevalence between post-diagnosis months 3 and 12 (
p = 0.120) or between post-diagnosis months 6 and 12 (
p = 0.118). The Wilcoxon signed-rank test corroborated the hypothesis that fibrotic lesions seen on CT scans acquired at month 3 persisted at month 6 (Z = 1.26;
p = 0.208) and at month 12 (Z = 1.17;
p = 0.241), as detailed in Table 3. For the 3-month time point, the meta-analysis stratified by severity of the acute phase resulted in a pooled estimate of 31.0% (95% CI: 18.0–44.0%) in the group in which it was classified as severe and of 5.5% (95% CI: 0.0–14.0%) in the group in which it was classified as moderate.
Statistical heterogeneity (expressed as the
I2 statistic), also called inconsistency, is the measure of how different the elements of a study sample are from each other
(50). In the case of systematic reviews, the
I2 statistic quantifies the differences between the primary studies included in the review, because they are the units of occurrence of the sample. However, the intrinsic diversity of the population of each primary study indirectly affects interpretation of the results of the review
(51). The forest plots presented in this work (Figures 5 to 8) summarize, individually and in combination, the effect estimate (prevalence of altered CT scans) and the confidence intervals (dispersion). There was considerable heterogeneity among the studies in our sample in terms of the prevalence of altered CT scans, even when stratified by the severity of the acute phase of COVID-19. That could limit the representativeness of the results in relation to the general population, given that other characteristics of the participants may have contributed to the inconsistency.
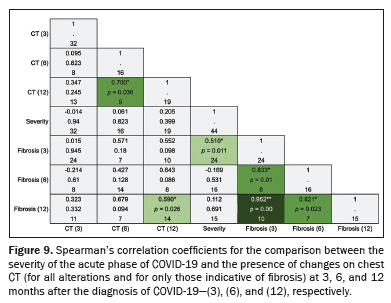
Correlation between variablesThe correlations that the severity of the acute phase of COVID-19 showed with the presence of altered CT scans at the three time points and with specific alterations are illustrated in Figure 9. The acute phase of COVID-19 being classified as severe or critical showed a moderate correlation with the presence of lesions indicative of fibrosis on the 3-month CT scan (rho-
s = 0.510;
p = 0.011). The presence of fibrotic alterations on the 3-month CT scan showed strong and very strong positive correlations, respectively, with their persistence on the 6-month CT scan (rho-
s = 0.833;
p = 0.01) and on the 12-month CT scan (rho-
s = 0.952;
p < 0.001). No correlation was observed between the severity of the acute phase and the overall presence of lesions on the 3-month CT scan (rho-
s = –0.014;
p = 0.94), 6-month CT scan (rho-
s = 0.061;
p = 0.823) or 12-month CT scan (rho-
s = 0.205;
p = 0.399).
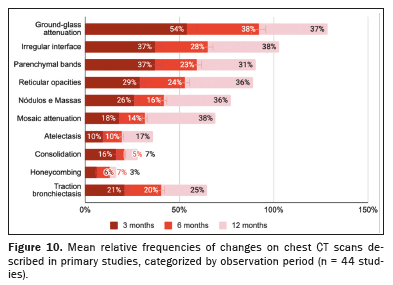
Specific CT findingsThe mean relative frequencies of the main CT alterations reported in the primary studies are shown in Figure 10 and Table 4. The proportions were calculated in relation to the total number of examinations performed during the study period.
Of the 3,981 CT scans performed at 3 months after the COVID-19 diagnosis, 2,508 (63.0%) were altered. The most commonly observed alterations were ground-glass attenuation (in 54.0 ± 4.2%), parenchymal bands (in 37.0 ± 5.1%), reticular opacities (in 29.0 ± 4.1%), nodules/masses (in 26.0 ± 7.0%), traction bronchiectasis (in 21.0 ± 4.1%), and mosaic attenuation (in 18.0 ± 10.0%).
Of the 2,137 CT scans performed at 6 months after the COVID-19 diagnosis, 1,229 (57.5%) were altered. The most commonly observed lesions were ground-glass attenuation (in 38.0 ± 5.8%), reticular opacities (in 24.0 ± 5.0%), parenchymal bands (in 23.0 ± 3.5%), traction bronchiectasis (in 20.0 ± 5.5%), nodules/masses (in 16.0 ± 8.0%), and mosaic attenuation (in 14.0 ± 1.8%).
Of the 1,967 CT scans performed at 12 months after the COVID-19 diagnosis, 846 (43.0%) were altered. The most commonly observed lesions were mosaic attenuation (in 38.0 ± 15.0%), ground-glass attenuation (in 37.0 ± 5.4%), nodules/masses (in 36.0 ± 8.5%), reticular opacities (in 36.0 ± 6.4%), parenchymal bands (in 31.0 ± 7.2%), and traction bronchiectasis (in 25.0 ± 6.5%).
Meta-analyses were generated to estimate the pooled prevalence for each type of lesion seen on CT at each of the three time points evaluated
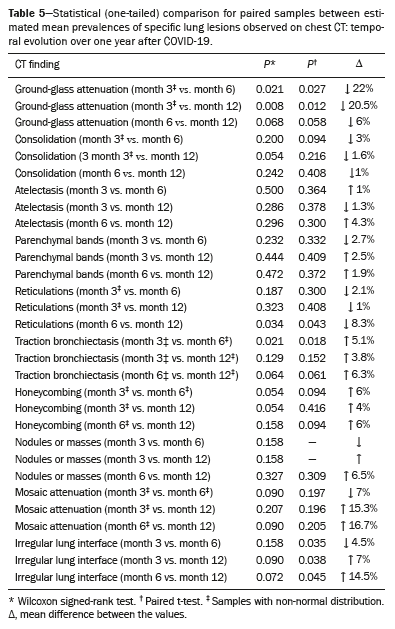
(4). Those results were compared with each other to analyze their temporal behavior (Table 5). Over the course of the observation period, there were statistically significant reductions in ground-glass attenuation, the mean prevalence of which decreased by 22% from post-diagnosis month 3 to post-diagnosis month 6 (
p = 0.021) and by 21% from post-diagnosis month 3 to post-diagnosis month 12 (
p = 0.008). There was no significant difference between month 6 and month 12 in terms of the mean prevalence of ground-glass opacity (
p = 0.068). There was a 5% increase in the pooled prevalence of traction bronchiectasis from month 3 to month 6 (
p = 0.018). There was no significant difference between month 6 and month 12 in terms of the pooled prevalence of traction bronchiectasis (
p = 0.061). These findings suggest stability of the lesions at six months after the acute phase of COVID-19. Interstitial thickening (reticulation) remained stable until post-diagnosis month 6 (Wilcoxon signed-rank,
p = 0.187), with a statistically significant increase of 8% in its pooled prevalence between post-diagnosis months 6 and 12 (
p = 0.034). The Wilcoxon signed-rank test and the paired-samples t-test showed that there was no difference between the mean prevalence rates of the other alterations over the course of the observation period.
DISCUSSIONThe persistence of symptoms after pneumonia resulting from infection with severe acute respiratory syndrome coronavirus 2 (SARS-CoV-2) is still a relevant issue in medical practice. Some of those symptoms can be related to lung alterations diagnosable by imaging. This systematic review included the sample prevalence of 44 studies on CT alterations in the lungs of adults at 3, 6, and 12 months after moderate-to-severe COVID-19. The pooled prevalence rates were calculated by meta-analysis, and these summary measures were compared by using appropriate statistical tests, not only for analyzing the temporal evolution of lesions but also for correlation with the severity of the acute phase of the disease. The information presented here contributes to the elucidation of the natural history of post-acute COVID-19 syndrome. In addition, it provides a semiotic assessment that assists radiologists in the interpretation of serial examinations, identifying the most common alterations and their propensity for progression.
Approximately 69% of the chest CT scans acquired 3 months after the acute phase of COVID-19 showed some residual lesion. That proportion fell to 62% by month 6 and to 54% by month 12. In comparison with the CT results obtained in month 3, those obtained in month 12 had, on average, returned to normal in 18% of the examinations. Findings related to pulmonary fibrosis were present in 22% of the CT scans acquired at post-diagnosis month 3, and there was no significant reduction in that prevalence from month 3 to month 12. That supports the hypothesis that COVID-19 is associated with pulmonary fibrosis, regardless of the age of the individual
(52). In this review, we found no correlation between severity in the acute phase of COVID-19 and the persistence of lesions on CT in general. However, there was a moderate correlation between severity in the acute phase and the presence of lesions indicative of pulmonary fibrosis at 3 months after the diagnosis.
Ground-glass opacity was the most common CT alteration at all time points. From post-diagnosis month 3 to post-diagnosis month 6, there was a statistically significant reduction in the prevalence of ground-glass attenuation, as well as a statistically significant increase in the prevalence of traction bronchiectasis, although the number of reticular opacities remained stable. From post-diagnosis month 6 to post-diagnosis month 12, there was no significant change in the prevalence of ground-glass opacity or traction bronchiectasis, suggesting that COVID-19–related lesions stabilize by 6 months after the diagnosis. However, there was a moderately significant increase in the prevalence of reticular opacities between month 6 and month 12.
The meta-analysis revealed high heterogeneity across the different outcomes studied in the post-acute COVID-19 syndrome setting, including general CT findings and fibrotic sequelae. That heterogeneity persisted despite attempts to contain it by stratifying the data by disease severity and specific type of CT finding. The overall prevalence range of pulmonary alterations on chest CT scans was considerably wide for all three of the time points evaluated, especially at post-diagnosis month 3, when it ranged from 20% to 100%.
It is believed that the heterogeneity across studies is attributable, at least in part, to the technique employed to read CT scans, because inconsistencies were observed in the description and classification of lesions, particularly for interstitial changes with irregular interfaces. Future studies could further analyze factors potentially associated with the significant differences between studies, such as age, smoking, and underlying disease. That technique could increase the reliability of the results.
Previous reviews
(53,54) have also described heterogeneity across studies as a limitation. Bocchino et al.
(53) conducted a systematic review estimating the prevalence (global and individual) of any type of residual lung alteration related to COVID-19 on chest CT scans acquired at one year after diagnosis, including studies published up through January 2023. The authors estimated the prevalence of such lung alterations at 43.5% (range, 7.1–96.7%), with no influence from the characteristics of interest of the individuals in the study populations (age, sex, smoking history, comorbidities, or severity of the acute phase). They assessed the prevalence of the main lesions seen on CT scans. As in our study, the most common alteration was ground-glass attenuation, with a pooled prevalence of 23.8% and high heterogeneity.
Our study has limitations other than the considerable heterogeneity of the data. We did not have access to previous chest CT scans of the study participants, contributing to a confounding bias between the presence of previous lung disease and lesions resulting from infection with SARS-CoV-2. The lack of detailed clinical data in the studies evaluated in our review precluded a more robust analysis of the correlation between radiological findings and persistent clinical symptoms. In addition, participant COVID-19 vaccination history was not considered. The January 2024 cutoff could be viewed as another limitation. That cutoff was set because the work was conducted within the context of a master’s project with a previously established timeline. However, updating the review would require a new methodological process, given that the PRISMA protocol steps were strictly followed, including double screening, assessment of the risk of bias, and standardized data extraction.
CONCLUSIONIt seems that CT alterations in the lung parenchyma persist in a significant number of patients with post-acute COVID-19 syndrome, even up to 12 months after the acute phase of the disease. Findings associated with pulmonary fibrosis can be observed in approximately 20% of CT scans at the 3-month follow-up evaluation, with no reduction in prevalence in subsequent follow-up examinations. The severity of the acute phase of COVID-19 does not appear to be related to the persistence of lesions on chest CT scans in general. However, severe or critical disease during the acute phase was found to correlate strongly with the presence of lesions indicative of fibrosis on CT scans acquired at 3, 6, and 12 months after the diagnosis of COVID-19. The data indicated an increase in the prevalence of interstitial thickening, with no relevant change in the prevalence of ground-glass attenuation or traction bronchiectasis, after post-diagnosis month 6. The collective sample presented significant heterogeneity, which impedes the generalizability of the results to the general population. Further research could deepen the stratified analysis and elucidate the factors associated with heterogeneity.
Data availabilityThe data supporting the results of this study are published in the body of this article.
REFERENCES1. National Institute for Health and Care Excellence. COVID-19 rapid guideline: managing the long-term effects of COVID-19. [Internet]. [acessado em 15/2/2025]. Disponível em:
https://www.nice.org.uk/guidance/ng188.
2. Fernández-Plata R, Higuera-Iglesias AL, Torres-Espíndola LM, et al. Risk of pulmonary fibrosis and persistent symptoms post-COVID-19 in a cohort of outpatient health workers. Viruses. 2022;14:1843.
3. Mulet A, Tarrasó J, Rodríguez-Borja E, et al. Biomarkers of fibrosis in patients with COVID 19 one year after hospital discharge: a prospective cohort study. Am J Respir Cell Mol Biol. 2023;69:321–7.
4. Araújo TP. Prevalência de alterações pulmonares na síndrome pós-Covid-19: revisão sistemática de estudos observacionais após quadro moderado a crítico de Covid-19 [dissertação]. [Internet]. [acessado em: 17/5/2025]. Disponível em:
http://repositorio.unb.br/handle/10482/52067.
5. Baratella E, Ruaro B, Marrochio C, et al. Interstitial lung disease at high resolution CT after SARS-CoV-2-related acute respiratory distress syndrome according to pulmonary segmental anatomy. J Clin Med. 2021;10:3985.
6. Chen Y, Ding C, Yu L, et al. One-year follow-up of chest CT findings in patients after SARS-CoV-2 infection. BMC Med. 2021;19:191.
7. Farghaly S, Badedi M, Ibrahim R, et al. Clinical characteristics and outcomes of post-COVID-19 pulmonary fibrosis: a case-control study. Medicine (Baltimore). 2022;101:e28639.
8. Han X, Fan Y, Alwalid O, et al. Fibrotic interstitial lung abnormalities at 1-year follow up CT after severe COVID 19. Radiology. 2021;301:E438–E440.
9. Huang J, Lin R, Bai N, et al. Six-month follow-up after recovery of COVID-19 Delta variant survivors via CT-based deep learning. Front Med (Lausanne). 2023;10:1103559.
10. Lenoir A, Christe A, Ebner L, et al. Pulmonary recovery 12 months after non-severe and severe COVID-19: the prospective Swiss COVID-19 lung study. Respiration. 2023;102:120–33.
11. Li X, Shen C, Wang L, et al. Pulmonary fibrosis and its related factors in discharged patients with new corona virus pneumonia: a cohort study. Respir Res. 2021;22:203.
12. Stewart I, Jacob J, George PM, et al. Residual lung abnormalities after COVID-19 hospitalization: interim analysis of the UKILD post-COVID-19 study. Am J Respir Crit Care Med. 2023;207:693–703.
13. Zhang D, Zhang C, Li X, et al. Thin-section computed tomography findings and longitudinal variations of the residual pulmonary sequelae after discharge in patients with COVID-19: a short-term follow-up study. Eur Radiol. 2021;31:7172–83.
14. Zubairi ABS, Shaikh A, Zubair SM, et al. Persistence of post-COVID lung parenchymal abnormalities during the three-month follow-up. Adv Respir Med. 2021;89:477–83.
15. Huang L, Yao Q, Gu X, et al. 1-year outcomes in hospital survivors with COVID-19: a longitudinal cohort study. Lancet. 2021;398:747–58.
16. Zou JN, Sun L, Wang BR, et al. The characteristics and evolution of pulmonary fibrosis in COVID 19 patients as assessed by AI-assisted chest HRCT. PLoS One. 2021;16:e0248957.
17. Bernardinello N, Cocconcelli E, Giraudo C, et al. Predictors of pulmonary sequelae after COVID-19 pneumonia: a 12-month follow-up study. Front Med (Lausanne). 2023;10:1084002.
18. Bocchino M, Lieto R, Romano F, et al. Chest CT-based assessment of 1-year outcomes after moderate COVID-19 pneumonia. Radiology. 2022;305:479–85.
19. Luger AK, Sonnweber T, Gruber L, et al. Chest CT of lung injury 1 year after COVID-19 pneumonia: the CovILD study. Radiology. 2022;304:462–70.
20. Eberst G, Claudé F, Laurent L, et al. Result of one-year, prospective follow-up of intensive care unit survivors after SARS-CoV-2 pneumonia. Ann Intensive Care. 2022;12:23.
21. González J, Zuil M, Benítez ID, et al. One year overview and follow-up in a post-COVID consultation of critically ill patients. Front Med. 2022;19.
22. Froidure A, Mahsouli A, Liistro G, et al. Integrative respiratory follow-up of severe COVID-19 reveals common functional and lung imaging sequelae. Respir Med. 2021;181:106383.
23. Karampitsakos T, Sotiropoulou V, Katsaras M, et al. Post-COVID-19 interstitial lung disease: insights from a machine learning radiographic model. Front Med (Lausanne). 2023;9:1083264.
24. Kumar K, Ratnakumar R, Collin SM, et al. Chest CT features and functional correlates of COVID-19 at 3 months and 12 months follow-up. Clin Med (Lond). 2023;23:467–77.
25. Kurys-Denis E, Grzywa-Celińska A, Kawa M. A comprehensive study of persistent changes on lung computed tomography scans of convalescent patients 3 months after recovery from severe and moderate COVID-19 pneumonia. Pol Arch Intern Med. 2022;132:16242.
26. Lazar M, Barbu EC, Chitu CE, et al. Interstitial lung fibrosis following COVID-19 pneumonia. Diagnostics (Basel). 2022;12:2028.
27. Lorent N, Weygaerde YV, Claeys E, et al. Prospective longitudinal evaluation of hospitalised COVID-19 survivors 3 and 12 months after discharge. ERJ Open Res. 2022;8:00004-2022.
28. Mostafa Y, Khalil MMM, Hegazy SNA, et al. The outcome of pulmonary function tests and high-resolution computed tomography of chest in post-coronavirus disease 2019-confirmed cases after 3 months of recovery. Egypt J Chest Dis Tuberc. 2023;72:46–57.
29. Nabahati M, Ebrahimpour S, Tabari RK, et al. Post-COVID-19 pulmonary fibrosis and its predictive factors: a prospective study. Egypt J Radiol Nucl Med. 2021;52:248.
30. Poerio A, Carlicchi E, Lotrecchiano L, et al. Evolution of COVID-19 pulmonary fibrosis-like residual changes over time – longitudinal chest CT up to 9 months after disease onset: a single-center case series. SN Compr Clin Med. 2022;4:57.
31. Polat G, Özdemir Ö, Ermin S, et al. Factors affecting the risk of interstitial lung disease development in hospitalized patients with COVID-19 pneumonia. Respir Care. 2022;67:1272–81.
32. van Raaij BFM, Stöger JL, Hinnen C, et al. Fibrotic-like abnormalities notably prevalent one year after hospitalization with COVID-19. Respir Med Res. 2022;82:100973.
33. Vural A, Kahraman AN. Pulmonary fibrotic-like changes on follow-up chest CT exam in patients recovering from COVID-19 pneumonia. Tuberk Toraks. 2021;64:492–8.
34. Zhao YM, Shang YM, Song WB, et al. Follow-up study of the pulmonary function and related physiological characteristics of COVID-19 survivors three months after recovery. EClinicalMedicine. 2020;25:100463.
35. Zhou M, Xu J, Liao T, et al. Comparison of residual pulmonary abnormalities 3 months after discharge in patients who recovered from COVID-19 of different severity. Front Med (Lausanne). 2021;8:682087.
36. Wu X, Liu X, Zhou Y, et al. 3-month, 6-month, 9-month, and 12-month respiratory outcomes in patients following COVID-19-related hospitalisation: a prospective study. Lancet Respir Med. 2021;9:747–54.
37. Pan F, Yang L, Liang B, et al. Chest CT patterns from diagnosis to 1 year of follow-up in patients with COVID-19. Radiology. 2022;302:709–19.
38. Vijayakumar B, Tonkin J, Devaraj A, et al. CT lung abnormalities after COVID-19 at 3 months and 1 year after hospital discharge. Radiology. 2022;303:444–54.
39. Marando M, Fusi-Schmidhauser T, Tamburello A, et al. 1-year radiological, functional and quality-of-life outcomes in patients with SARS-CoV-2 pneumonia – a prospective observational study. NPJ Prim Care Respir Med. 2022;32:8.
40. Zangrillo A, Belletti A, Palumbo D, et al. One-year multidisciplinary follow-up of patients with COVID-19 requiring invasive mechanical ventilation. J Cardiothorac Vasc Anesth. 2022;36:1354–63.
41. Tarraso J, Safont B, Carbonell-Asins JA, et al. Lung function and radiological findings 1 year after COVID-19: a prospective follow-up. Respir Res. 2022;23:242.
42. Bardakci MI, Ozturk EN, Ozkarafakili MA, et al. Evaluation of long-term radiological findings, pulmonary functions, and health-related quality of life in survivors of severe COVID-19. J Med Virol. 2021;93:5574–81.
43. Besutti G, Monelli F, Schirò S, et al. Follow-up CT patterns of residual lung abnormalities in severe COVID-19 pneumonia survivors: a multicenter retrospective study. Tomography. 2022;8:1184–95.
44. Caruso D, Guido G, Zerunian M, et al. Post-acute sequelae of COVID-19 pneumonia: six-month chest CT follow-up. Radiology. 2021;01:E396–E405.
45. Han X, Fan Y, Alwalid O, et al. Six-month follow-up chest CT findings after severe COVID-19 pneumonia. Radiology. 2021;299:E177–E186.
46. Faverio P, Luppi F, Rebora P, et al. One-year pulmonary impairment after severe COVID-19: a prospective, multicenter follow-up study. Respir Res. 2022;23:65–65.
47. Liao T, Meng D, Xiong L, et al. Long-term effects of COVID-19 on health care workers 1-year post-discharge in Wuhan. Infect Dis Ther. 2022;11:145–63.
48. Russo G, Flor N, Casella F, et al. Lung ultrasound in the follow-up of severe COVID-19 pneumonia: six months evaluation and comparison with CT. Intern Emerg Med. 2022;17:2261–8.
49. Li Y, Han X, Huang J, et al. Follow-up study of pulmonary sequelae in discharged COVID-19 patients with diabetes or secondary hyperglycemia. Eur J Radiol. 2021;144:109997.
50. Brasil. Ministério da Saúde. Diretrizes metodológicas. Sistema GRADE – manual de graduação da qualidade da evidência e força de recomendação para tomada de decisão em saúde. Brasília, DF; 2014. 72 p.
51. Dancey CP, Reidy JG, Rowe R. Estatística sem matemática para as ciências da saúde. Porto Alegre, RS: Penso; 2017.
52. Tanni SE, Fabro AT, Albuquerque A, et al. Pulmonary fibrosis secondary to COVID-19: a narrative review. Expert Rev Respir Med. 2021;15:791–803.
53. Bocchino M, Rea G, Capitelli L, et al. Chest CT lung abnormalities 1 year after covid 19: a systematic review and meta-analysis. Radiology. 2023;308:e230535.
54. Lee JH, Yim JJ, Park J. Pulmonary function and chest computed tomography abnormalities 6-12 months after recovery from COVID-19: a systematic review and meta-analysis. Respir Res. 2022;23:233.
1. Secretaria de Saúde do Distrito Federal, Brasília, DF, Brazil
2. Programa de Pós-graduação em Engenharia Biomédica (PPGEB), Universidade de Brasília, Brasília, DF, Brazil
3. Centro Universitário do Planalto Central Aparecido dos Santos (UNICEPLAC), Brasília, DF, Brazil
4. Ministério da Saúde do Brasil, Brasília, DF, Brazil
5. Procuradoria Geral da União, Brasília, DF, Brazil
6. Serviço Federal de Processamento de Dados (SERPRO), Brasília, DF, Brazil
a.
https://orcid.org/0000-0002-5914-7811b.
https://orcid.org/0000-0002-5385-6174c.
https://orcid.org/0000-0001-8584-9676d.
https://orcid.org/0009-0008-0109-6362e.
https://orcid.org/0000-0003-1267-5171Correspondence:Dra. Tatiane Peroba Araújo
Área Especial de Indústria Projeção A – Universidade de Brasília, Setor Leste, Gama. Brasília, DF, Brazil, 72444-240. Email:
tratianeperoba@gmail.com
Received in
February 6 2025.
Accepted em
June 30 2025.
Publish in
November 7 2025.

 |
|
