Radiologia Brasileira - Publicação Científica Oficial do Colégio Brasileiro de Radiologia
AMB - Associação Médica Brasileira CNA - Comissão Nacional de Acreditação
 Vol. 52 nº 5 - Sep. / Oct. of 2019
|
ORIGINAL ARTICLE
|
|
Microvascular invasion in hepatocellular carcinoma: is it predictable with quantitative computed tomography parameters? |
|
|
Autho(rs): Daniel Lahan-Martins1; Simone Reges Perales2; Stephanie Kilaris Gallani3; Larissa Bastos Eloy da Costa4; Eduardo Andreazza Dal Lago5; Ilka de Fátima Santana Ferreira Boin6; Nelson Marcio Gomes Caserta7; Elaine Cristina de Ataide8 |
|
|
Keywords: Carcinoma, hepatocellular; Tomography, X-ray computed; Liver neoplasms/surgery; Liver transplantation. |
|
|
Abstract: INTRODUCTION
Hepatocellular carcinoma (HCC) is one of the most frequently diagnosed cancers and a leading cause of cancerrelated death worldwide(1). The presence of microvascular invasion (MVI) has been reported to be one of the most significant independent risk factors affecting recurrencefree survival and a major risk factor for a poor outcome following partial hepatic resection or liver transplantation in HCC patients within the Milan criteria(2,3). Therefore, predicting MVI preoperatively could allow appropriate patient selection for each treatment. As the technology has evolved, imaging has come to play an increasingly more important role in HCC evaluation. Triphasic dynamic multidetector computed tomography (CT), which includes arterial, portal venous, and equilibrium phases, is considered to be the primary approach for the diagnosis of HCC worldwide. In comparison with the background liver parenchyma, the typical HCC is hyperdense in the arterial phase (arterial hyperenhancement), isodense or hypodense in the portal venous phase, and hypodense in the equilibrium phase, hypodensity also being referred to as washout appearance(4,5). The identification of arterial hyperenhancement and washout appearance is based solely on the visual (subjective) assessment. As has been proposed by some authors(6), quantitative measurement of these phenomena would reduce the chances of misinterpretation, thus avoiding incorrect diagnosis and inappropriate patient management. The aim of this study was to determine whether quantitative measurements of dynamic CT could be useful in predicting MVI in HCC. To that end, we reviewed such measurements in a group of patients with HCC. MATERIALS AND METHODS Patient selection We retrospectively reviewed 161 consecutive patients (238 lesions) who underwent liver transplantation or surgical hepatic resection between March 2010 and November 2017 and had surgically proven HCC. All of the patients evaluated had been submitted to a dedicated triphasic CT liver protocol within the last six months before surgery. Patients who had no previous CT study on file at our institution were excluded, as were those in whom the CT study was incomplete (unenhanced or biphasic CT only), those submitted to chemoembolization prior to surgery, and those diagnosed with a combination of HCC and cholangiocarcinoma. Thus, we included 200 lesions in 125 patients (98 men, 27 women; mean age, 59 years; age range, 3681 years). Of those 125 patients, 72 (57.6%) had hepatitis C, 11 (8.8%) had hepatitis B, 5 (4.0%) had coinfection with hepatitis C and hepatitis B, and 20 (16.0%) had cryptogenic cirrhosis. All procedures were conducted in accordance with the principles of the Declaration of Helsinki, and the study was approved by the local institutional review board. The requirement for informed consent was waived. Pathology The specimens and liver explants were fixed in 10% formalin and embedded in paraffin. Three- to five-micrometer sections were affixed to slides, deparaffinized, and stained with hematoxylin and eosin. All slides were examined by a senior hepatopathologist. Liver CT technique All studies were performed in a 16-slice multidetector CT scanner (BrightSpeed 16; GE Healthcare, Milwaukee, WI, USA) or in a 64-slice multidetector CT scanner (Aquilion 64; Toshiba Medical Systems, Tochigi, Japan). Typically, 120 mL (or less for patients with low weight) of contrast material (Henetix 300 [iobitridol, 300 mg I/mL]; Guerbet, Sulzbach, Germany, or Omnipaque 300 [ioexol, 300 mg I/mL]; GE Healthcare, Amersham, UK) were power injected intravenously at a rate of 45 mL/s, and that was followed by a saline flush. No contrast medium was administered orally or rectally. Images were acquired prior to contrast administration, as well as in the arterial phase (1015 s after peak abdominal aortic enhancement), portal venous phase (80 s after intravenous contrast injection), and equilibrium phase (180 s after intravenous contrast injection). Bolus tracking software (SmartPrep; GE Healthcare, or SureStart; Toshiba Medical Systems) was used. The scanning parameters were 1.01.25 mm section collimation and a 3.0-mm reconstruction interval. Image analysis An abdominal radiologist with 11 years of experience, who was blinded to the pathology results, reviewed all of the imaging studies. On the arterial-, portal venous-, and equilibrium-phase images, circular or oval regions of interest (ROIs) were manually drawn over the lesion, as well as over two adjacent areas of the liver, and Hounsfield units were measured. In heterogeneous lesions, the area with the most significant arterial hyperenhancement was considered for analysis, together with the corresponding portal venous and equilibrium phase measurements for that area. Care was taken to avoid any blood vessels, biliary ducts, or artifacts. The CT values for the two ROIs drawn over the adjacent areas of the liver were averaged. The attenuation difference was defined as the difference between the attenuation of lesion and that of the adjacent areas of the liver and was calculated in all three phases (arterial, portal venous, and equilibrium). The percentage attenuation ratio (PAR), attenuation difference, and relative washout ratio (RWR) for the portal venous and equilibrium phases were calculated as follows: 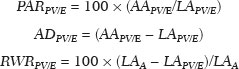 where PARPV/E is the PAR in the portal venous phase (PV) or equilibrium phase (E); AAPV/E is the average of the two areas adjacent to the lesion (AA) in the PV or E; LAPV/E is the attenuation of the lesion (LA) in the PV or E; ADPV/E is the attenuation difference in the PV or E; RWRPV/E is the RWR in the PV or E; and LAA is the LA in the arterial phase (A). All attenuation measurements were expressed in Hounsfield units. Figure 1 demonstrates a representative, surgically proven HCC in the arterial, portal venous, and equilibrium phases, with attenuation measurements. 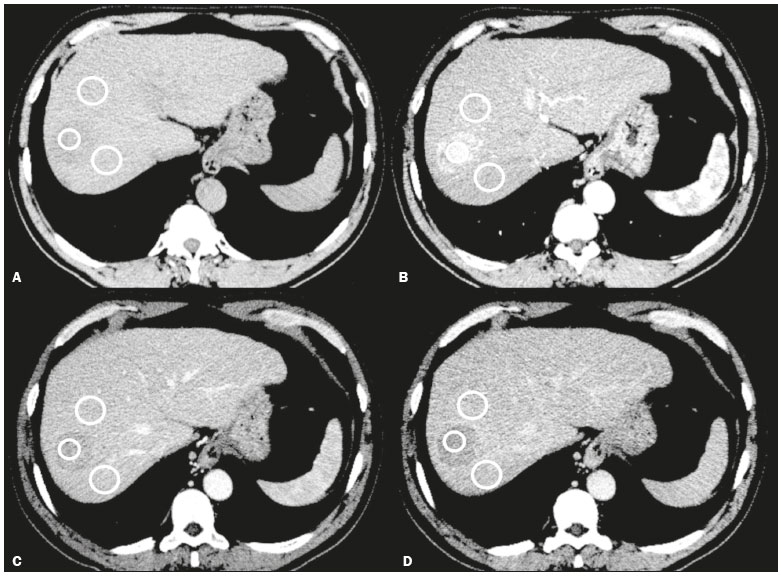 Figure 1. HCC. Unenhanced CT image (A), together with CT images obtained in the arterial phase (B), portal venous phase (C), and equilibrium phase (D), with ROIs positioned over the lesion and over two areas of the adjacent liver parenchyma. Data analysis and statistics Generalized estimating equations and a logistic regression model with correlated data analysis were used for the univariate analysis. No variables were sufficiently significant to be included in a multivariate analysis. To identify the independent predictors of MVI among the CT parameters, we constructed a receiver operating characteristic curve for repeated measures analysis of variance. Statistical analyses were performed with the SAS System for Windows, version 9.4 (SAS Institute Inc.; Cary, NC, USA). Values of p < 0.05 were considered statistically significant. RESULTS We collected CT data for 161 patients with surgically proven HCC (238 lesions). Thirty-six patients (38 lesions) were excluded from the analysis, either because they did not meet the study criteria or because the data were incomplete. Therefore, the final sample comprised 200 lesions in 125 patients. The mean lesion size was 3.0 cm (range, 1.025.0 cm; median 2.2 cm). Of the 125 patients, 69 (55.2%) had one lesion and 56 (44.8%) had two or more (range 26; median, 2.9). In the histopathological analysis, MVI was found in 77 (38.5%) of the 200 lesions evaluated. In the subjective analysis, 179 (89.5%) of the HCCs showed arterial hyperenhancement (i.e., were hypervascular), 127 (63.5%) showed washout in the portal venous phase and 194 (97.0%) showed washout only in the equilibrium phase. Figure 2 shows the distribution of attenuation values of HCCs and of the adjacent areas of the liver in the arterial, portal venous, and equilibrium phases, in lesions with and without MVI. 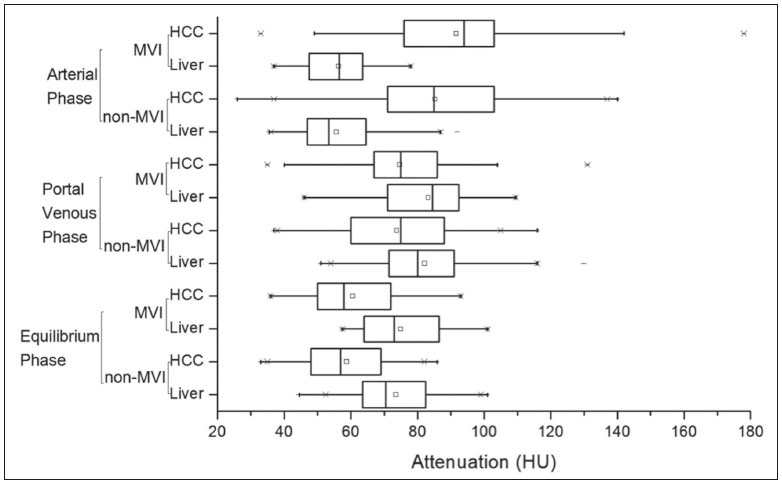 Figure 2. Box plot showing the distribution of attenuation values of HCCs with MVI (MVI HCC) and without MVI (non-MVI HCC) in the arterial, portal venous, and equilibrium phases. To depict the dynamics of HCCs with greater precision, quantitative enhancement profiles were assessed. The first of such profiles was assessed by calculating the PAR for each lesion in the portal venous and equilibrium phases. There was no statistically significant difference in the PAR between the HCCs with MVI and those without, in the portal venous phase (median PAR, 114.7 and 115.8, respectively) or in the equilibrium phase (median PAR, 126.7 and 128.2, respectively). Another quantitative enhancement profile was assessed by calculating the RWR (defined as 100 × the ratio between the lesion attenuation in the arterial phase and that observed in the subsequent phase) for each lesion. In terms of the RWR, there was no statistically significant difference between the HCCs with MVI and those without, in the portal venous phase (median RWR, 15.0 and 8.2, respectively) or in the equilibrium phase (median RWR, 31.4 and 26.3, respectively). The third enhancement profile assessed was the attenuation difference (defined as the difference between the attenuation of lesion and the average attenuation of the two adjacent areas of the liver parenchyma). Again, there was no statistically significant difference between the HCCs with MVI and those without, in the arterial phase (median attenuation difference, 35.2 and 29.6, respectively), portal venous phase (median attenuation difference, −8.5 and −8.3, respectively), or equilibrium phase (median attenuation difference, −14.5 and −14.8, respectively). Table 1 shows a descriptive analysis of all of the parameters studied. Table 2 shows the results of the univariate logistic regression of the factors studied to discriminate MVI. Table 3 shows a comparative analysis of all quantitative CT enhancement profiles in patients with and without MVI. 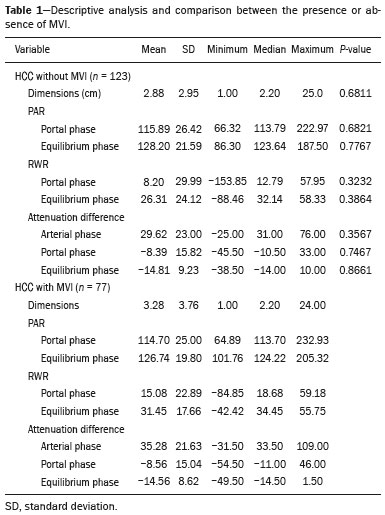 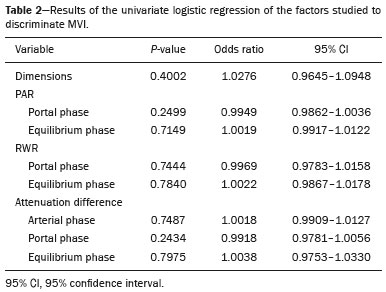 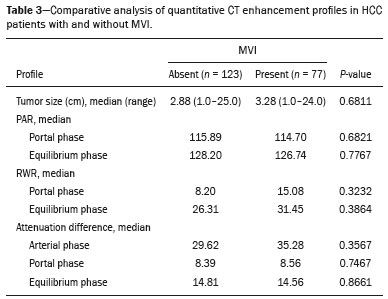 DISCUSSION MVI is frequently described as a major risk factor for a poor outcome in patients with HCC submitted to liver transplantation or surgical hepatic resection(2,710). MVI is beyond the limits of imaging resolution and therefore cannot be directly visualized with current imaging methods. Contrast-enhanced CT is a relatively simple, noninvasive method that is widely used in order to evaluate patients with HCC in routine clinical practice. Almost all patients who will be submitted to liver transplantation or hepatic resection undergo a preoperative CT scan. Therefore, it would be reasonable to identify biomarkers from a relative simple method such as contrast-enhanced CT. In the present study, we investigated the correlation between quantitative contrast-enhanced CT parameters and MVI in pathologically proven HCCs. We found that none of the quantitative CT parameters evaluated were predictive of MVI in patients with HCC submitted to curative surgical treatment. Although MVI in HCC is one of the most important predictors of recurrence and survival after liver transplantation or hepatic resection, it is difficult to identify MVI through imaging studies. A number of biomarkers have been tested in attempts to predict MVI, some producing contradictory or inconclusive results(1113). Morphological criteria, such as the presence of internal arteries or tumor necrosis, have been associated with MVI(14). Pawlik et al.(15) found that an HCC diameter > 5 cm should be considered a poor prognostic factor because of the high incidence of MVI among such lesions. Chandarana et al.(16) found tumor multifocality to correlate with MVI. Chou et al.(17) and Lim et al.(18) showed that the absence of a capsule, invasion of the capsule, and an irregular tumor margin all correlate positively with MVI. However, Miyata et al.(19) found that the presence or absence of a capsule did not correlate with MVI. Magnetic resonance imaging (MRI) is another important method for the diagnosis of HCC(2023). Some functional MRI parameters, especially those determined with diffusion-weighted imaging (DWI), have also been investigated as potential predictors of outcomes in patients with HCC. Xu et al.(24) demonstrated that HCCs with MVI have lower apparent diffusion coefficient (ADC) values on DWI than do those without MVI, showing that the ADC value, at a cutoff of 1.227 × 10⁻³ mm2/s, has a sensitivity and specificity of 66.7% and 78.6%, respectively, for detecting small HCCs. Suh et al.(25) showed that the ADC value, at a cutoff of 1.11 × 10⁻³ mm2/s, has a sensitivity of 93.5% and a specificity of 72.2% for the prediction of MVI. Yang et al.(26) proposed a biomarker based on the relationship between DWI and T2-weighted MRI sequences, specifically a DWI/T2 mismatch, and found it to have a high specificity (95.6%) but a very low sensitivity (18.1%) for the prediction of MVI in HCC. Kim et al.(27) reported that a hypointense signal in the region surrounding a tumor in the hepatobiliary phase of gadoxetate disodium-enhanced MRI has a high specificity but low sensitivity for predicting MVI in HCC. Lee et al.(28) found that combining that condition with arterial peritumoral enhancement, a non-smooth tumor margin, or both had a specificity > 90% for predicting MVI in HCC. However, Kim et al.(12) showed that the probability of MVI was low in HCCs showing an isointense or hyperintense signal on gadoxetate disodiumenhanced MRI. The expression of certain CT biomarkers, such as those based on texture analysis, has also been proposed as a predictor of MVI in HCC, producing promising results in a few studies(29,30). However, further studies of such biomarkers are needed. Our study has some limitations. The retrospective nature of the study could have introduced a detection bias. In addition, there are some technical limitations, such as a lack of optimization of the dose of contrast medium in relation to body weight, the fact that the images were acquired in two different CT scanners (although the technical parameters were similar), and the fact that our results depended on the ROIs being drawn correctly. Furthermore, we did not take into consideration certain clinical criteria, such as the Child-Pugh classification, which can be associated with changes in liver perfusion. Moreover, we did not assess the histological grade of the HCCs, nor did we evaluate a method that allows objective assessment of a lesion and its heterogeneity, such as texture analysis. Finally, we assessed HCCs only on the basis of the presence or absence of MVI. In one recent study, patients were further categorized into different grades of MVI, based on the number of vessels involved(3). Therefore, further studies are warranted in order to determine the true applicability of CT biomarkers as predictors of MVI. In conclusion, although CT is the most widely used method and plays an important role in the evaluation of patients who will undergo HCC resection or liver transplantation, it has certain limitations in predicting MVI. This study highlights those limitations, showing that the proposed quantitative approach is not useful for achieving that goal. REFERENCES 1. Ferlay J, Soerjomataram I, Dikshit R, et al. Cancer incidence and mortality worldwide: sources, methods and major patterns in GLOBOCAN 2012. Int J Cancer. 2015;136:E35986. 2. Sumie S, Kuromatsu R, Okuda K, et al. Microvascular invasion in patients with hepatocellular carcinoma and its predictable clinicopathological factors. Ann Surg Oncol. 2008;15:137582. 3. Sumie S, Nakashima O, Okuda K, et al. The significance of classifying microvascular invasion in patients with hepatocellular carcinoma. Ann Surg Oncol. 2014;21:10029. 4. Elsayes KM, Kielar AZ, Agrons MM, et al. Liver Imaging Reporting and Data System: an expert consensus statement. J Hepatocell Carcinoma. 2017;4:2939. 5. Forner A, Reig M, Bruix J. Hepatocellular carcinoma. Lancet. 2018; 391:130114. 6. Liu YI, Shin LK, Jeffrey RB, et al. Quantitatively defining washout in hepatocellular carcinoma. AJR Am J Roentgenol. 2013;200:849. 7. Agopian VG, Harlander-Locke M, Zarrimpar A, et al. A novel prognostic nomogram accurately predicts hepatocellular carcinoma recurrence after liver transplantation: analysis of 865 consecutive liver transplant recipients. J Am Coll Surg. 2015;220:41627. 8. Iguchi T, Shirabe K, Aishima S, et al. New pathologic stratification of microvascular invasion in hepatocellular carcinoma predicting prognosis after living-donor liver transplantation. Transplantation. 2015;99:123642. 9. Liu J, Zhu Q, Li Y, et al. Microvascular invasion and positive HBe antigen are associated with poorer survival after hepatectomy of early hepatocellular carcinoma: a retrospective cohort study. Clin Res Hepatol Gastroenterol. 2018;42:3308. 10. Cheng Z, Yang P, Qu S, et al. Risk factors and management for early and late intrahepatic recurrence of solitary hepatocellular carcinoma after curative resection. HPB(Oxford). 2015;17:4227. 11. Witjes CDM, Willemssen FEJA, Verheij J, et al. Histological differentiation grade and microvascular invasion of hepatocellular carcinoma predicted by dynamic contrast-enhanced MRI. J Magn Reson Imaging. 2012;36:6417. 12. Kim JY, Kim MJ, Kim KA, et al. Hyperintense HCC on hepatobiliary phase images of gadoxetic acid-enhanced MRI: correlation with clinical and pathological features. Eur J Radiol. 2012;81:387782. 13. Zhao WC, Fan LF, Yang N, et al. Preoperative predictors of microvascular invasion in multinodular hepatocellular carcinoma. Eur J Surg Oncol. 2013;39:85864. 14. Banerjee S, Wang DS, Kim HJ, et al. A computed tomography radiogenomic biomarker predicts microvascular invasion and clinical outcomes in hepatocellular carcinoma. Hepatology. 2015;62:792 800. 15. Pawlik TM, Delman KA, Vauthey JN, et al. Tumor size predicts vascular invasion and histologic grade: implications for selection of surgical treatment for hepatocellular carcinoma. Liver Transpl. 2005;11:108692. 16. Chandarana H, Robinson E, Hajdu CH, et al. Microvascular invasion in hepatocellular carcinoma: is it predictable with pretransplant MRI? AJR Am J Roentgenol. 2011;196:10839. 17. Chou CT, Chen RC, Lin WC, et al. Prediction of microvascular invasion of hepatocellular carcinoma: preoperative CT and histopathologic correlation. AJR Am J Roentgenol. 2014;203:W2539. 18. Lim JH, Choi D, Park CK, et al. Encapsulated hepatocellular carcinoma: CT-pathologic correlations. Eur Radiol. 2006;16:232633. 19. Miyata R, Tanimoto A, Wakabayashi G, et al. Accuracy of preoperative prediction of microinvasion of portal vein in hepatocellular carcinoma using superparamagnetic iron oxide-enhanced magnetic resonance imaging and computed tomography during hepatic angiography. J Gastroenterol. 2006;41:98795. 20. Siqueira GRS, Guimarães MD, Franco LFS, et al. Exophytic hepatocellular carcinoma, simulating a mesenchymal tumor, in a noncirrhotic liver. Radiol Bras. 2017;50:623. 21. Ramalho M, Matos AP, AlObaidy M, et al. Magnetic resonance imaging of the cirrhotic liver: diagnosis of hepatocellular carcinoma and evaluation of response to treatment Part 1. Radiol Bras. 2017; 50:3847. 22. Ramalho M, Matos AP, AlObaidy M, et al. Magnetic resonance imaging of the cirrhotic liver: diagnosis of hepatocellular carcinoma and evaluation of response to treatment Part 2. Radiol Bras. 2017; 50:11525. 23. Melo-Leite AF. The powerful lens of magnetic resonance imaging in the diagnosis of hepatic nodules in patients with cirrhosis: diagnosis of hepatocellular carcinoma without the need of histopathological confirmation fact! Radiol Bras. 2017;50(1):viiviii. 24. Xu P, Zeng M, Liu K, et al. Microvascular invasion in small hepatocellular carcinoma: is it predictable with preoperative diffusionweighted imaging? J Gastroenterol Hepatol. 2014;29:3306. 25. Suh YJ, Kim MJ, Choi JY, et al. Preoperative prediction of the microvascular invasion of hepatocellular carcinoma with diffusionweighted imaging. Liver Transpl. 2012;18:11718. 26. Yang C, Wang H, Sheng R, et al. Microvascular invasion in hepatocellular carcinoma: is it predictable with a new, preoperative application of diffusion-weighted imaging? Clin Imaging. 2017;41:101 5. 27. Kim KA, Kim MJ, Jeon HM, et al. Prediction of microvascular invasion of hepatocellular carcinoma: usefulness of peritumoral hypointensity seen on gadoxetate disodium-enhanced hepatobiliary phase images. J Magn Reson Imaging. 2012;35:62934. 28. Lee S, Kim SH, Lee JE, et al. Preoperative gadoxetic acid-enhanced MRI for predicting microvascular invasion in patients with single hepatocellular carcinoma. J Hepatol. 2017;67:52634. 29. Zhou W, Zhang L, Wang K, et al. Malignancy characterization of hepatocellular carcinomas based on texture analysis of contrastenhanced MR images. J Magn Reson Imaging. 2017;45:147684. 30. Ahn SJ, Kim JH, Park SJ, et al. Hepatocellular carcinoma: preoperative gadoxetic acid-enhanced MR imaging can predict early recurrence after curative resection using image features and texture analysis. Abdom Radiol (NY). 2019;44:53948. 1. Hospital de Clínicas da Universidade Estadual de Campinas (HC-Unicamp), Campinas, SP, Brazil; https://orcid.org/0000-0003-4691-7634 2. Hospital de Clínicas da Universidade Estadual de Campinas (HC-Unicamp), Campinas, SP, Brazil; https://orcid.org/0000-0003-2263-9254 3. Faculdade de Ciências Médicas da Universidade Estadual de Campinas (FCM-Unicamp), Campinas, SP, Brazil; https://orcid.org/0000-0002-3449-5502 4. Hospital de Clínicas da Universidade Estadual de Campinas (HC-Unicamp), Campinas, SP, Brazil; https://orcid.org/0000-0001-6932-8600 5. Hospital de Clínicas da Universidade Estadual de Campinas (HC-Unicamp), Campinas, SP, Brazil; https://orcid.org/0000-0003-1564-387X 6. Faculdade de Ciências Médicas da Universidade Estadual de Campinas (FCM-Unicamp), Campinas, SP, Brazil; https://orcid.org/0000-0002-1165-2149 7. Faculdade de Ciências Médicas da Universidade Estadual de Campinas (FCM-Unicamp), Campinas, SP, Brazil; https://orcid.org/0000-0001-8404-8092 8. Faculdade de Ciências Médicas da Universidade Estadual de Campinas (FCM-Unicamp), Campinas, SP, Brazil; https://orcid.org/0000-0002-2672-7326 Correspondence: Dr. Daniel Lahan Martins Departamento de Radiologia HC-Unicamp Rua Tessália Vieira de Camargo, 126, Cidade Universitária Campinas, SP, Brazil, 13083-887 Email: dlahan@unicamp.br Received 30 October 2018 Accepted after revision 21 February 2019 Publication date: 08/08/2019 |
|
Av. Paulista, 37 - 7° andar - Conj. 71 - CEP 01311-902 - São Paulo - SP - Brazil - Phone: (11) 3372-4544 - Fax: (11) 3372-4554