Radiologia Brasileira - Publicação Científica Oficial do Colégio Brasileiro de Radiologia
AMB - Associação Médica Brasileira CNA - Comissão Nacional de Acreditação
 Vol. 47 nº 6 - Nov. / Dec. of 2014
|
ORIGINAL ARTICLE
|
|
X-linked adrenoleukodystrophy: correlation between Loes score and diffusion tensor imaging parameters |
|
|
Autho(rs): Sergio Eiji Ono1; Arnolfo de Carvalho Neto2; Emerson Leandro Gasparetto3; Luiz Otávio de Mattos Coelho4; Dante Luiz Escuissato2; Carmem Maria Sales Bonfim5; Lisandro Lima Ribeiro6 |
|
|
Keywords: X-linked adrenoleukodystrophy; Diffusion tensor imaging; Loes score; Magnetic resonance imaging. |
|
|
Abstract: INTRODUCTION
X-linked adrenoleukodystrophy (X-ALD), registered at the Johns Hopkins University OMIM® library (Online Mendelian Inheritance in Man®) under reference #300100, is a disease secondary to ABCD1 gene mutation, resulting in defective peroxisomal beta-oxidation and accumulation of very-long-chain saturated fatty acids (VLCFA) in all tissues of the body. It is genetically determined as a X-chromosomelinked recessive inheritance. The disease manifests primarily in the adrenal cortex, central nervous system myelin and Leydig cells in the testicles. Plasma VLCFA analysis is the most commonly utilized test in the diagnosis of this disease, and the patient's phenotype should be carefully evaluated, since it frequently changes over time(1). Approximately 50% of the patients presenting with the genetic defect of X-ALD develop the cerebral inflammatory form of the disease, at some stage in life, more commonly in the childhood, between 4 and 8 years of age. At the disease onset, the neurological development and cognitive functions are normal and magnetic resonance imaging (MRI) findings in the brain precede the symptoms(2); and, on their turn, reports on findings at proton MR spectroscopy (MRS) precede those at conventional MRI(3,4). In approximately 80% to 85% of such patients, the initial and severest lesions involve the parieto-occipital regions. The abnormal VLCFA accumulation in the white matter plays a significant role in the myelin and axonal destruction cascade that occurs in this phenotype. The gold-standard scoring system to evaluate the evolvement of X-ALD was proposed by Loes in 1994(5): a 34-point severity scale for brain MRI findings, based on the location and extent of involvement, and on the presence of either focal or global atrophy. Sites selected for severity scoring include the temporo-anterior, frontal and parieto-occipital white matter, corpus callosum, visual and auditory tracts, projection fibers, cerebellum and basal ganglia. The severity scoring system aids in the determination of the extent and damage to myelin in the brain. One considers a very early stage if the score is < 4, an early stage if the score is between 4 and 8, a late stage for score is between 9 and 13, and an advanced stage for score > 13. The Loes score is one of the parameters utilized in the disease follow-up and provides guidance on therapeutic decisions for hematopoietic cell transplant (HCT). At MRI, the progression of X-ALD-related alterations is associated with the patient's age, initial score at diagnosis and anatomic location of the lesions (MRI pattern). As such data are evaluated as a whole, they aid in the prediction of the disease course and in the selection of patients for BMT(6). Peters et al.(7) suggest that patients with a Loes score < 9 may benefit from BMT; however more recent opinions indicate that even lower scores (< 4) may be more appropriate to indicate candidates for BMT(8). BMT cannot be justified in the absence of demyelination (i.e., Loes score = 0), because 60% to 85% of the boys will not develop brain disease in their childhood(7). BMT is the only treatment capable of interrupting the demyelination process in X-ALD patients, resulting in good quality of life in the long term, provided the procedure is performed at the initial stage of the disease(9), showing five-year survival in 89% to 95% of cases, as compared with a survival probability of 45% to 54% in patients not submitted to BMT(7,10,11). However, a definitive cure still remains a goal to achieve(12). Considering that an early diagnosis and timely transplant are essential for optimizing the results, it is expected that the utilization of advanced MRI techniques may be useful in the therapeutic decision making process. The anisotropic water diffusion in nerve fibers is the basis for the utilization of diffusion-tensor imaging (DTI) to establish the nerve fibers pathway. The fact that water diffusion is sensitive to the subjacent tissue microstructure provides a method to evaluate the orientation and integrity of such nerve fibers, which may be useful in the evaluation of several neurologic diseases(13). DTI has several applications, and several studies have demonstrated anisotropy change in demyelinating diseases, particularly in multiple sclerosis(1417). Other studies have demonstrated that MRI parameters reliably correlate with white matter histopathological parameters as DTI measurements are utilized(18,19). DTI parameters evaluated in the present study were fractional anisotropy (FA), mean, radial and axial diffusivity (MD, RD and AD). DTI is a mathematical model represented by a vector matrix, where the three DTI axes are called eigenvectors, whose magnitudes are the eigenvalues. The largest vector corresponds to the longitudinal or axial diffusivity (AD) and the average of the remaining vectors corresponds to RD. The average of the three eigenvalues corresponds to MD. The FA measures the "degree of directionality" of the intravoxel diffusivity, with values ranging from zero, in the case of isotropic diffusion, to 1, indicating a perfectly linear diffusion(20). In a study approaching ALD, Ito et al.(21) have evaluated 11 male patients and measured FA in areas with altered signal, demonstrating the reduction of such value as compared with apparently normal areas. In 2003, an article published by Schneider et al.(22), evaluated the FA in three patients and reported the FA reduction as compared with seven controls, suggesting such parameter as an indicator of demyelination in areas considered as normal at conventional MRI study. Because of the small number of observations, the evaluation in larger series was suggested. Increases in RD are related to damage in the myelin, and axonal damages would be related to increased AD values(23). No studies are found in the literature studying ALD under the method and scores proposed in the present study. MATERIALS AND METHODS The present study was approved by the Committee for Ethics in Research on Humans of Hospital de Clínicas de Curitiba Universidade Federal do Paraná (HC-UFPR), accredited by the Comissão Nacional de Ética em Pesquisa (National Committee for Ethics in Research) of the Brazilian Ministry of Health. MRI studies of 14 male patients in the age range between four and 20 years, with ALD diagnosis were evaluated, and nine of those patients had undergone BMT (Table 1). The scans were performed in a period of five years and three months, from March 2007 to June 2012. The study is retrospective, evaluating the DTI of routine MRI scans from patients followed-up by the Service of Bone Marrow Transplant at HC-UFPR. 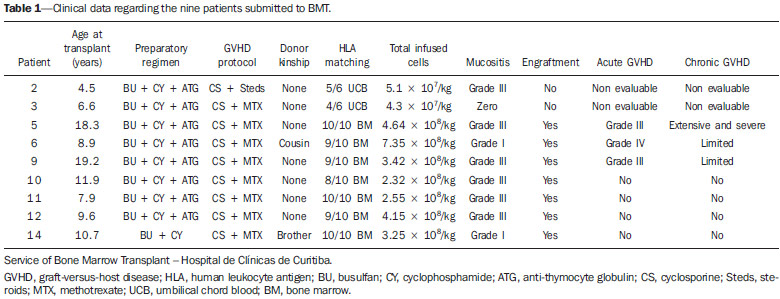 DTI parameters measurements were performed on a control group of 28 male patients in the age range between four and 20 years, whose clinical complaints were not attributed to white matter diseases (investigation of headaches, internal ear disorders and disease in the orbit and sella turcica regions, and study of extra axial lesions arachnoid cyst) and with normal results at conventional MRI. The MRI scans were performed in a high magnetic field 1.5 T equipment (Magnetom® Avanto; Siemens AG, Erlangen, Germany), with the following parameters: FLAIR sequence (sagittal plane; TR = 7000 ms; TE = 384 ms; TI = 2500 ms; slice thickness = 1 mm; 424 × 512 matrix; and FOV = 230 × 280 mm) for conventional evaluation of morphological changes and lesion signs, determining the Loes score, and DTI (axial plane; TR = 4900 ms; TE = 103 ms; slice thickness of 3 mm; 192 × 192 matrix and FOV = 230 × 230 mm; 12 directions). The scans of individuals in control group were performed in the same equipment, with DTI parameters adjusted for clinical evaluation, as follows: TR = 3100 ms, TE = 95 ms, slice thickness = 5 mm, 148 × 148 matrix, FOV = 230 × 230 mm, 12 directions. Two radiologists with over five-year experience in neuroradiology (observer 1: Ono SE, and observer 2: Coelho LOM) carried out the interpretation of the conventional images (FLAIR) for the Loes scoring and the readings of the DTI parameters. The interpretation of the FLAIR images was independently performed, and in case of disagreement, the Loes scoring was made by consensus. The readings of the DTI parameters were independently obtained for evaluation of intra- and interobserver agreement. The reading, interpretation and calculation of the Loes score were directly obtained, by analysis of FLAIR images utilizing the DICOM file viewer (Kodak Carestream PACS Client Suite) On the other hand, the DTI processing generates several measurements, particularly FA, MD, RD and AD obtained with the open source software DTI-Studio, release 3.0.3 (https://www.mristudio.org). With the maps of the DTI parameters, measurements of FA, trace and RD were made on predetermined regions of interest (ROIs) taking the sites reported on the study by Schneider et al.(22) as reference The measurements of the DTI parameters were bilaterally performed at nine sites in a total of 18 measurements, as follows: anterior and posterior limbs of the internal capsule, semioval center, parietal white matter, occipital white matter, anterior temporal white matter, frontal white matter and corpus callosum (genu and splenium). Figure 1 shows such sites on a standard image, and Figure 2 shows an example of the measurement, of FA, trace, RD and main eigenvalue (corresponding to AD) values in one of the patients. The DTI-Studio was utilized for such reading. The measurement of the MD parameter was derived from the trace measurement (MD = trace/3). The AD parameter was obtained by means of the formula: AD = trace 2 × RD. At the end, all 18 measurements of each parameter were summed up in order to obtain a single value that could be correlated with the Loes score. For FA measurements, one expects a negative correlation, with decrease of FA; and for the measurements of MD, RD and AD, one expects a positive correlation between the values.  Figure 1. Proposed ROIs on the FA map. A: Semioval center (left). B: White matter in the parietal lobe (right). C: White matter in the frontal lobe (left), corpus callosum genu (right portion), anterior limb of the internal capsule (right), posterior limb of the internal capsule (right), corpus callosum splenium (right portion). D: White matter in the occipital lobe (right). E: Temporal lobe (right). F: Example of FA measurement, corresponding to the color FA map on the picture C. The arrow indicates the ROI in the posterior limb of the right internal capsule, and the table shows the values obtained in the reading of such ROI, with an average of 0.71.  Figure 2. Illustration of the measurement with ROIs in one of the patients, with example in the white matter of the right parietal lobe. A: Axial FLAIR image. B: Color FA map. C: FA measurement. D: Measurement of the tensor trace. E: Radial diffusivity. F: Eingenvalue 0 (axial diffusivity). RESULTS The statistical analysis of the collected data was based on the Pearson (r) correlation coefficients, with the level of statistical significance depending upon the size of the compared groups. Values of p < 0.05 indicate statistical significance. A correlation was considered as being strong for coefficients (r) > 0.7. The analysis of the DTI measurements in patients of the control group (paired by age) was made in order to obtain DTI parameters estimated with mean values and standard deviations of FA, MD, RD and AD. The intraobserver analysis was made with data collected by the observer 1 with data from the ALD patients, with measurements of DTI parameters taken at a one-week interval. The interobserver analysis of data from ALD patients compared results from observer 1 (average of the two measurements utilized in the intraobserver analysis) with measurements from observer 2 (single measurement). The interobserver analysis of data from the control group compared data collected by observers 1 and 2. The DTI measurements utilized for correlation with the Loes score were the average of the results obtained by observer 1 (average of two measurements) and by observer 2 (single measurement). The results from the 30 scans of the 14 ALD patients are demonstrated on Table 2. 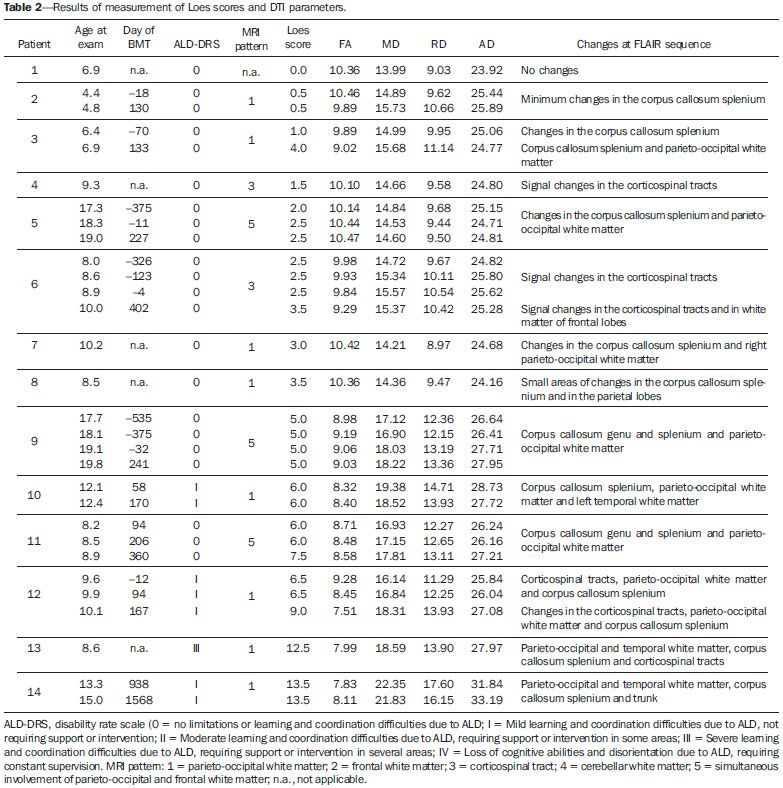 The intraobserver statistical analysis of the DTI scores of the ALD patients' images demonstrated Pearson coefficients of 0.96, 0.96, 0.95 and 0.80 for FA, MD, RD and AD scores, respectively, all of them with a significance level p < 0.01. The interobserver statistical analysis of data from ALD patients presented Pearson coefficients of 0.97 for FA, MD and RD scores, and 0.94 for the AD score (p < 0.01). The measurements of the DTI parameters in the control group suggest that developmental changes still occur in the age range between 4 and 20 years. Trend lines show a decrease in MD, RD, and AD scores, and increase in the FA score. Considering that the control group is small and that the Pearson correlation coefficient in relation to age shows none or little correlation, the sample of 28 patients in the control group was utilized to obtain the values for means and standard-deviations for that age group (FA = 10.23 ± 0.48; MD = 14.20 ± 0.63; RD = 8.84 ± 0.76 and AD = 24.91 ± 0.57). The statistical analysis of the correlations between the DTI measurements and Loes scores in ALD patients obtained correlation coefficients of 0.86, 0.89, 0.80 and 0.84 for the measurements of FA, MD, RD and AD, all with p < 0.01 (Figure 3). 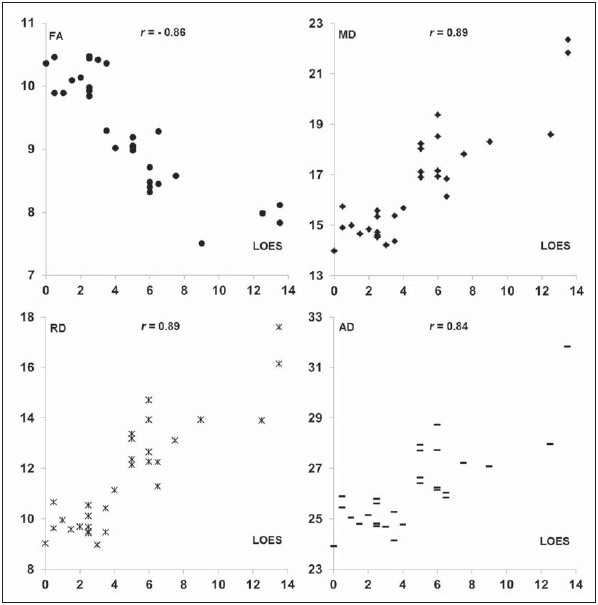 Figure 3. Analysis of Loes scores and of DTI measurements. DISCUSSION Brain MRI in X-ALD patients is important to demonstrate the progression of the lesions(24). Conventional MRI is highly sensitive to detect white matter abnormalities, but specificity is low. Pathological findings related to signal changes are highly variable and include hypomyelination, demyelination, axonal loss, gliosis, interstitial edema and cystic degeneration of the white matter(18). Advanced MRI techniques, such as proton spectroscopy and, in particular, diffusion-weighted imaging seem to improve sensitivity and specificity of the evaluation using MRI, since it provides a more accurate identification and differentiation of such pathological processes(25,26). The hypothesis is that the DTI parameters correlate with the degree of demyelination and severity of the disease. The statistical analysis demonstrated strong correlation between the DTI parameters and Loes scores, with Pearson correlation coefficients above 0.84, in absolute values (p < 0.01). No data are found in the literature to evaluate the measurements of the DTI, and it was necessary to obtain reference values (controls) paired with the cases under study. The DTI parameters are considered to be relatively stable after 24 months of life(27), but changes still occur after this period, during the brain development(28). This was observed in the control group, with DTI measurements indicating a tendency towards increase in FA and decrease in MD, RD and AD, considering the total contributions of the sampled white matter, despite none or little correlation with age. Such a fact was taken into considered in order to obtain the mean values and standard-deviations of the DTI values in the control age group. In spite of the Loes score allowing for the evaluation of several possible alterations with scores between 0 and 34, the original article demonstrated that the studied group had a mean score of 9, with values between 0.5 and 25 in a sample of 83 patients(5). The present study sample includes patients with Loes scores ranging from 0 to 13.5 (including patients at very early, early and late stages of disease), a relative limitation considering the objective of correlating scores, actually evaluating scores in the range of interest for decision of BMT, as higher score values (very late stage) are not considered for such a procedure. Another limitation is related to the acquisition parameters, with a focus on the reduction of the acquisition time in order to minimize motion artifacts. The DTI acquisition utilized 12 directions, while simulation studies indicate that at least 20 directions are necessary for a robust estimation of anisotropy, and at least 30 directions for a robust estimation of the tensor(29). Another problem is the selection of the ROI, which is observer-dependent. The locations of the proposed ROIs are fixed, but they may not include regions with changes, and in the case of areas with apparently normal white matter and areas with changes, it can be difficult to select the limits of the ROI. An important observation on the severity scale proposed by Loes lies on the fact that subtle changes at conventional MRI may not result in an increase in the score, generating some uncertainty on the disease progression considering the interpretation of the conventional images. An early identification of demyelination is important, considering that the patient may benefit from BMT before the neurologic deficits become noticeable. Analyzing the DTI measurements of patients 1 to 8 (Table 2), one can observe some tendencies previously suggested by Schneider et al.(22). The patient number 2 demonstrated changes in the MD and RD measurements, despite of low Loes scores. The patient number 3 presented with changes in the MD and RD (more than one standard-deviation), with a Loes score of 1, and subsequently a significant change was observed in these measurements (more than two standard-deviations) and a sudden change in the Loes score. Patient number 5 demonstrated disease stability after BMT and the DTI measurements demonstrated little changes. The patient number 6 demonstrated progressive changes in the DTI measurements in spite of unaltered Loes scores before the BMT. Such patients did not present with significant changes in FA measurements. In a certain way, this is in agreement with what Schneider et al. observed in their study, as MD values showed more noticeable pathological changes than the FA values in the apparently normal white matter(22). The small number of patients limits the statistical analysis; but it is important to observe the tendency of changes in DTI measurements, despite the unaltered Loes scores, particularly in the score range between 0 and 4, which is considered as being the interest range where ALD patients would benefit the most. Only the allogeneic hematopoietic cell transplant can lead to long term disease stabilization and increase in survival(11). BMT is recommended at the early stage of ALD, requiring reliable clinical parameters and complementary exams to increase the chances of positive results, and the present study is aimed at providing an additional method to support the follow-up of ALD patients. A more detailed analysis of DTI measurements in the severity score range between 0 and 4 demonstrated a tendency towards change in DTI parameters, despite the unaltered Loes score, indicating that MD and RD measurements may be potentially useful in cases of very early and early stages of the disease, and might be utilized as follow-up parameters as an adjuvant to the Loes score. However, further studies with larger patient series are necessary to validate the proposed method for clinical purposes. It is also suggested that the tensor evaluation might be more accurate with the utilization of techniques for a global evaluation of DTI parameters, with the statistical processing based on tracts, for example, the Tract-Based Spatial Statistics (TBSS)(30), rather than on ROIs. CONCLUSION The evaluation of the DTI parameters on follow-up images of X-ALD patients demonstrated correlation with Loes scores; and at early stages of the disease it could provide further information in relation to the conventional images, with changes being detected on MD and RD measurements. However, considering the sample size and study limitations, it is suggested that further studies be undertaken with a higher number of patients, for a better demonstration of the correlations observed in the present study. REFERENCES 1. Moser HW. Therapy of X-linked adrenoleukodystrophy. NeuroRx. 2006;3:246-53. 2. Moser HW, Barker PB. Magnetic resonance spectroscopy: a new guide for the therapy of adrenoleukodystrophy. Neurology. 2005;64:406-7. 3. Pouwels PJ, Kruse B, Korenke GC, et al. Quantitative proton magnetic resonance spectroscopy of childhood adrenoleukodystrophy. Neuropediatrics. 1998;29:254-64. 4. Eichler FS, Itoh R, Barker PB, et al. Proton MR spectroscopic and diffusion tensor brain MR imaging in X-linked adrenoleukodystrophy: initial experience. Radiology. 2002;225:245-52. 5. Loes DJ, Hite S, Moser H, et al. Adrenoleukodystrophy: a scoring method for brain MR observations. AJNR Am J Neuroradiol. 1994;15:1761-6. 6. Loes DJ, Fatemi A, Melhem ER, et al. Analysis of MRI patterns aids prediction of progression in X-linked adrenoleukodystrophy. Neurology. 2003;61:369-74. 7. Peters C, Charnas LR, Tan Y, et al. Cerebral X-linked adrenoleukodystrophy: the international hematopoietic cell transplantation experience from 1982 to 1999. Blood. 2004;104:881-8. 8. Warren DJ, Connolly DJA, Wilkinson ID, et al. Magnetic resonance spectroscopy changes following haemopoietic stem cell transplantation in children with cerebral adrenoleukodystrophy. Dev Med Child Neurol. 2007;49:135-9. 9. Cartier N, Aubourg P. Hematopoietic stem cell transplantation and hematopoietic stem cell gene therapy in X-linked adrenoleukodystrophy. Brain Pathol. 2010;20:857-62. 10. Mahmood A, Raymond GV, Dubey P, et al. Survival analysis of haematopoietic cell transplantation for childhood cerebral X-linked adrenoleukodystrophy: a comparison study. Lancet Neurol. 2007;6:687-92. 11. Miller WP, Rothman SM, Nascene D, et al. Outcomes after allogeneic hematopoietic cell transplantation for childhood cerebral adrenoleukodystrophy: the largest single-institution cohort report. Blood. 2011;118:1971-8. 12. Moser HW, Raymond GV, Dubey P. Adrenoleukodystrophy: new approaches to a neurodegenerative disease. JAMA. 2005;294:3131-4. 13. Beaulieu C. The basis of anisotropic water diffusion in the nervous system - a technical review. NMR Biomed. 2002;15:435-55. 14. Filippi M, Cercignani M, Inglese M, et al. Diffusion tensor magnetic resonance imaging in multiple sclerosis. Neurology. 2001;56:304-11. 15. Nucifora PGP, Verma R, Lee SK, et al. Diffusion-tensor MR imaging and tractography: exploring brain microstructure and connectivity. Radiology. 2007;245:367-84. 16. Castriota-Scanderbeg A, Fasano F, Hagberg G, et al. Coefficient D(av) is more sensitive than fractional anisotropy in monitoring progression of irreversible tissue damage in focal nonactive multiple sclerosis lesions. AJNR Am J Neuroradiol. 2003;24:663-70. 17. Roychowdhury S, Maldjian JA, Grossman RI. Multiple sclerosis: comparison of trace apparent diffusion coefficients with MR enhancement pattern of lesions. AJNR Am J Neuroradiol. 2000;21:869-74. 18. van der Voorn JP, Pouwels PJW, Powers JM, et al. Correlating quantitative MR imaging with histopathology in X-linked adrenoleukodystrophy. AJNR Am J Neuroradiol. 2011;32:481-9. 19. Seewann A, Vrenken H, van der Valk P, et al. Diffusely abnormal white matter in chronic multiple sclerosis: imaging and histopathologic analysis. Arch Neurol. 2009;66:601-9. 20. Mukherjee P, Berman JI, Chung SW, et al. Diffusion tensor MR imaging and fiber tractography: theoretic underpinnings. AJNR Am J Neuroradiol. 2008;29:632-41. 21. Ito R, Melhem ER, Mori S, et al. Diffusion tensor brain MR imaging in X-linked cerebral adrenoleukodystrophy. Neurology. 2001;56:544-7. 22. Schneider JFL, Il'yasov KA, Boltshauser E, et al. Diffusion tensor imaging in cases of adrenoleukodystrophy: preliminary experience as a marker for early demyelination? AJNR Am J Neuroradiol. 2003;24:819-24. 23. Song SK, Sun SW, Ju WK, et al. Diffusion tensor imaging detects and differentiates axon and myelin degeneration in mouse optic nerve after retinal ischemia. Neuroimage. 2003;20:1714-22. 24. Gasparetto EL, Rosa JM, Davaus T, et al. Cerebral X-linked adrenoleukodystrophy: follow-up with magnetic resonance imaging. Arq Neuropsiquiatr. 2006;64:1033-5. 25. Patay Z. Diffusion-weighted MR imaging in leukodystrophies. Eur Radiol. 2005;15:2284-303. 26. Bizzi A, Castelli G, Bugiani M, et al. Classification of childhood white matter disorders using proton MR spectroscopic imaging. AJNR Am J Neuroradiol. 2008;29:1270-5. 27. Hermoye L, Saint-Martin C, Cosnard G, et al. Pediatric diffusion tensor imaging: normal database and observation of the white matter maturation in early childhood. Neuroimage. 2006;29:493-504. 28. Kumar R, Nguyen HD, Macey PM, et al. Regional brain axial and radial diffusivity changes during development. J Neurosci Res. 2012;90:346-55. 29. Mukherjee P, Chung SW, Berman JI, et al. Diffusion tensor MR imaging and fiber tractography: technical considerations. AJNR Am J Neuroradiol. 2008;29:843-52. 30. Smith SM, Jenkinson M, Johansen-Berg H, et al. Tract-based spatial statistics: voxelwise analysis of multi-subject diffusion data. Neuroimage. 2006;31:1487-505. 1. Master, MD, Radiologist at Clínica DAPI Diagnóstico Avançado por Imagem, Curitiba, PR, Brazil 2. PhDs, Associate Professors, Universidade Federal do Paraná (UFPR), Radiologists at Clínica DAPI Diagnóstico Avançado por Imagem, Curitiba, PR, Brazil 3. PhD, Research Productivity Scholar Conselho Nacional de Desenvolvimento Científico e Tecnológico (CNPq), Course of Post-graduation in Medicine (Radiology), Department of Radiology, Universidade Federal do Rio de Janeiro (UFRJ), Rio de Janeiro, RJ, Brazil 4. Titular Member of Colégio Brasileiro de Radiologia e Diagnóstico por Imagem (CBR), MD, Radiologist at Clínica DAPI Diagnóstico Avançado por Imagem, Curitiba, PR, Brazil 5. MD, Hematologist, Coordinator for the Pediatric Bone Marrow Transplant Program at Hospital de Clínicas da Universidade Federal do Paraná (HC-UFPR), Curitiba, PR, Brazil 6. MD, Hematologist, Fanconi Anemia Clinica at Service of Bone Marrow Transplant, Hospital de Clínicas da Universidade Federal do Paraná (HC-UFPR), Curitiba, PR, Brazil Mailing Address: Dr. Sergio Eiji Ono DAPI Diagnóstico Avançado por Imagem Rua Brigadeiro Franco, 122, Mercês Curitiba, PR, Brazil, 80430-210 E-mail: ono.sergio@gmail.com Received August 18, 2013. Accepted after revision April 29, 2014. Study developed at Hospital de Clínicas da Universidade Federal do Paraná (HC-UFPR) and at Clínica DAPI Diagnóstico Avançado por Imagem, Curitiba, PR, Brazil. |
|
Av. Paulista, 37 - 7° andar - Conj. 71 - CEP 01311-902 - São Paulo - SP - Brazil - Phone: (11) 3372-4544 - Fax: (11) 3372-4554