Radiologia Brasileira - Publicação Científica Oficial do Colégio Brasileiro de Radiologia
AMB - Associação Médica Brasileira CNA - Comissão Nacional de Acreditação
 Vol. 46 nº 3 - May / June of 2013
|
ORIGINAL ARTICLE
|
|
Diagnosis of hepatic steatosis by contrast-enhanced abdominal computed tomography |
|
|
Autho(rs): Rodrigo da Fonseca Monjardim1; Danilo Manuel Cerqueira Costa1; Ricardo Francisco Tavares Romano1; Priscila Silveira Salvadori1; Jaime de Vargas Conde dos Santos1; Augusto Castelli Von Atzingen2; David Carlos Shigueoka3; Giuseppe D'Ippolito4 |
|
|
Keywords: Fatty liver; Steatosis; Liver disease; Tomography; Multidetector computed tomography; Contrast media. |
|
|
Abstract: INTRODUCTION
Hepatic steatosis (HS) has been considered a clinically significant condition due the increased risk for progression to necroinflammatory alterations, even in cases where the disease is not associated with alcohol consumption (in this case known as nonalcoholic steatohepatitis NASH), and to cirrhosis(1). Data from the United States of America estimates that 40 million adults are affected by NASH(1). Other studies indicate that the prevalence of HS in the general population may reach 24%(2,3). In cases where NASH is early diagnosed, the treatment may avoid progression to a final and irreversible stage of hepatic cirrhosis(4). Additionally, HS patients may be disqualified as eligible living liver donor candidates for hepatic transplant because the steatotic liver is more vulnerable to injuries from anesthetic procedures and ischemic reperfusion(57). In this context, up to 30% of living liver donor candidates are rejected for presenting hepatic steatosis(8). Percutaneous liver biopsy has been the reference standard for diagnosis and staging of HS(4), but it is an invasive method with possible complications. On the other hand, imaging methods such as ultrasonography (US), computed tomography (CT) and magnetic resonance imaging (MRI) have been extensively utilized, not only for the comprehensive assessment of abdominal disorders, but specifically in the diagnosis of HS(1,4,9). US, despite being widely available and without contraindications, relies on subjective and hardly reproducible criteria which do not allow a reliable quantification of steatosis(4). MRI is currently considered as being the most effective noninvasive method for the diagnosis of HS(4), but it is still a highly expensive method and is not widely available in our country. CT, on its turn, has been the method most widely utilized in the evaluation of abdominal disorders and is an important tool in the diagnosis of HS(10,11). Several factors have contributed to such a wide utilization, among them the development of multidetector CT apparatuses (MDCT), allowing faster images acquisition, with greater comfort for the patient and high diagnostic accuracy. However, the harmful effects of ionizing radiation inherent to the method have been a constant source of preoccupation(12,13). Among the several strategies for radiation dose reduction in CT scans, a thorough review of CT protocols has been recommended with the purpose of avoiding unnecessary scan phases(14). The contrast-enhanced portal phase performed between 60 and 80 seconds after intravenous contrast injection is isolatedly considered as being the most useful phase in the greatest majority of indications for upper abdomen CT, provided the reliability and diagnostic accuracy of the method is assured(9,14,15), leading to a tendency to abolish the non-contrast-enhanced phase. On the other hand, according to several authors, the CT criteria for diagnosis of HS are dependent on such phase(10,11,16). Such a fact has stimulated the undertaking of studies which attempted to establish the value of the portal phase isolatedly in the diagnosis of hepatic steatosis(9,10,17). The most recent of those studies demonstrated that, with the isolated utilization of the portal phase, it is possible to obtain accuracy similar to that obtained with the criteria adopted at non-contrastenhanced CT in the diagnosis and quantification of HS(9). The authors proposed a mathematical equation which takes into consideration the average density of the portal vein and the aorta based on measurements obtained at three different sites and the average density of the liver obtained from eight measurements (two for each one of the four segments of the right lobe). Such a strategy, in spite of having demonstrated good results, is time consuming for the investigator, making the method somewhat tiresome and certainly more complex than the simple measurements obtained with the non-contrast-enhanced phase. Additionally, the several variables involved in the process, such as concentration, contrast medium injection velocity and acquisition time may influence the results(16), lead to the necessity of validating the previous results and prove the usefulness of a simplified method for HS diagnosis by means of contrast-enhanced CT. Considering the prevalence of HS, the present study was aimed to evaluate the diagnostic capability of the portal phase with a simplified calculation method, as compared with the non-contrast-enhanced phase of abdominal CT. MATERIALS AND METHODS The present study was approved by the Committee for Ethics in Research of the authors' institution, and the application of a term of free and informed consent was waived. The abdominal CT images were retrospectively analyzed regardless of clinical indication, in the period between May, 2011 and February, 2012, until the arbitrarily established number of 100 HS patients, called "cases", and 50 HS-free patients, called "controls", was reached, utilizing non-contrast-enhanced CT as a reference imaging method. In the group of cases in the sample, 49 patients were men (mean age = 51.6 years ± 14.3) and 51 were women (mean age = 54.7 years ± 14.0). Among the "controls" 26 patients were men (mean age = 57.6 years ± 18.2) and 24 were women (mean age = 53.2 years ± 18.4). Only patients above the age of 18 and with spontaneous requests for contrast-enhanced abdominal CT were included in the present study. Exclusion criteria were the following: a) heterogeneous liver; b) patients with innumerable lesions in both liver lobes; c) inappropriate contrast medium injection (for example: contrast medium extravasation); d) images with artifacts (for example: respiratory artifacts) which would make density measurements inaccurate or unreliable; e) incomplete images. Non-inclusion criteria were the following: a) patients under the age of 18; b) indication for non-contrast-enhanced abdominal CT; c) patients with contraindication for iodinated contrast medium; d) splenectomized patients. The scans were performed in a Brilliance 64® model CT apparatus (Philips Medical Systems; Best, The Netherlands), with volumetric acquisition before and 70 seconds after intravenous injection of the hydrosoluble iodinated contrast medium, by means of an automatic injection pump at a rate of 34 ml/s and 1.52 ml/kg of body weight, with a maximum volume of 150 ml. The technical parameters commonly utilized at CT scans were the following: a) collimation of 64 × 0.625 mm; b) gantry rotation time = 0.5 s; c) reconstruction with 1 and 3 mm slice thickness; d) pitch = 0.891; e) 120 kVp; f) mAs depending upon automatic modulation of the radiation dose (DoseRight ACS®). All the images were interpreted by a single observer with three-year experience in imaging diagnosis, on a Synapse® PACS/3D (FujiFilm; USA) workstation. At the moment of the interpretation, none of the clinical data were available to the observer. The differentiation between the two patient groups was based on the diagnostic criteria for HS established for non-contrastenhanced CT, utilizing the analysis of hepatic and splenic attenuation values in Hounsfield units (HU), considering that a liver attenuation value lower than the splenic attenuation value indicates the diagnosis of steatosis(4,17,18). The diagnosis of HS with contrast-enhanced CT was obtained by means of the method proposed by Kim et al.(9), utilizing the formula [L 0.3 × (0.75 × P + 0.25 × A)] / 0.7, where L corresponds to hepatic attenuation, P corresponds to portal vein attenuation, and A corresponds to abdominal aorta attenuation. The measurements were performed in the portal venous contrast phase, i.e., between 60 and 80 seconds after the initiation of the intravenous contrast medium injection. In the original study, the variables L, P and A were obtained from the averages of eight measurements of the liver, three of the portal vein and three of the aorta, respectively, which makes the process quite burdensome and hardly practical. Some studies have proposed that the utilization of a single liver attenuation measurement does not present significant difference in relation to the average obtained after multiple measurements(11,19). With such premise in mind and with the objective of validating a simplified method for the diagnosis of HS relying on the portal phase isolatedly, a pilot study was initially undertaken with five patients without HS (liver attenuation value higher than splenic attenuation value in the non-contrast-enhanced phase), five with mild HS (difference between liver and spleen attenuation values > 10 HU), and five with severe HS (difference between liver and spleen attenuation values < 10 HU)(4), comparing the values resulting from the utilization of the above mentioned formula with all mean values of the variables (original method) with a single measurement for each variable (simplified method). The analysis of the pilot study was performed by two independent investigators blinded with respect to the results from the non-contrast-enhanced phase. A almostperfect agreement was observed between the original and the simplified methods of calculation (kappa = 0.842; p = 0.001). The initial results justified the continuity of the present study, applying the previously proposed formula(9) with a single measurement for each anatomical site (right hepatic lobe, portal vein and aorta), thus simplifying the method (Figure 1). 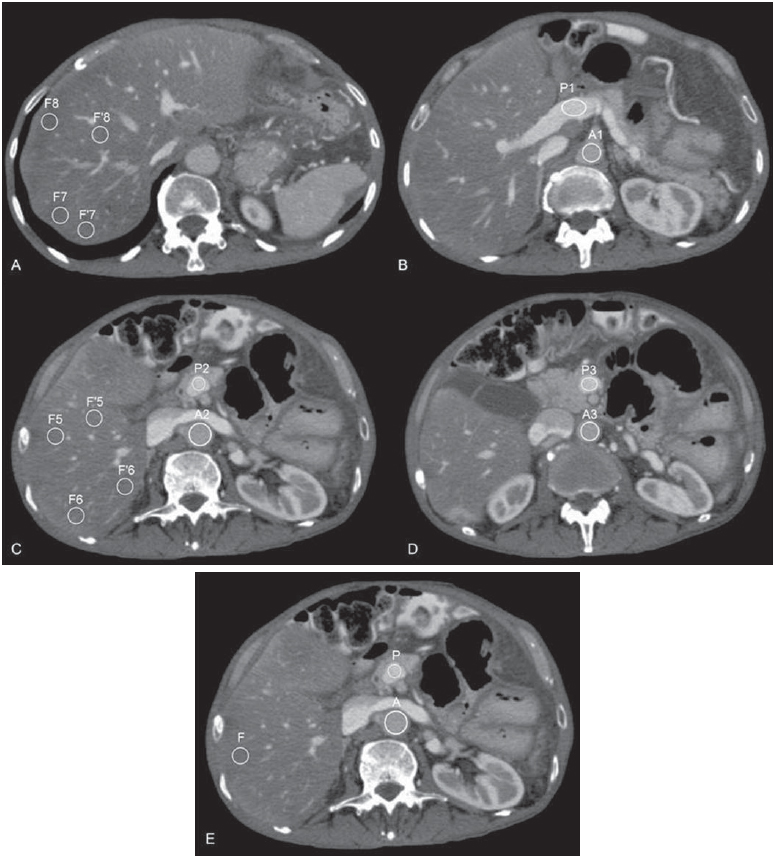 Figure 1. Measurements of attenuation required for the calculation according to the method originally proposed by Kim et al.(9) (AD) and according to the simplified method proposed by the present study (E). Kim et al.(9) have originally proposed that results from their formula < 104 HU are associated with steatosis grades > 5%. Therefore, in the present study, the cutoff point of < 104 HU was utilized as a diagnostic criterion for HS at the portal phase, indicating steatosis greater than 5%(2023). Liver density values were obtained by means of measurements of the liver attenuation on circular regions of interest (ROI) with 1.5 cm2(9) located in the right hepatic lobe(4), avoiding vessels and eventual focal lesions, both for the calculations in the non-contrast-enhanced phase and in the portal phase. The splenic attenuation was calculated in a similar manner. The measurements of attenuation in the portal vein and aorta were obtained at the level of the celiac trunk, utilizing the ROIs which occupied the largest possible area of the vascular lumen. The L, P and A attenuation values obtained in the analysis were entered into an Excel® worksheet prepared for the automatic calculation with the formula. For the purpose of statistical analysis, the patients were categorized as "with steatosis" and "without steatosis", both for the non-contrast-enhanced phase and the portal phase; and sensitivity, specificity, positive and negative predictive values as well as the false-positive and false-negative rates were calculated, considering the evaluation obtained at non-contrast-enhanced CT as a reference standard. RESULTS By applying the proposed method for the portal phase, from the 150 analyzed patients, 132 obtained results < 104 HU, meeting the criteria for HS, and 18 obtained results > 104 HU, being thus considered as negative for HS. The calculation of the portal phase accuracy with the proposed simplified method utilizing the non-contrast-enhanced phase as a reference standard provided the following results: 100% sensitivity; 36% specificity, 100% negative predictive value; and 75.8% positive predictive value. The false positive rate was 64%. No false negative result was observed. DISCUSSION Several studies have been undertaken by Brazilian authors approaching the importance of imaging methods in the evaluation of liver diseases(2428), with CT diagnosis of HS being traditionally made according the criteria applied to the non-contrast-enhanced phase(10,11,16). However, in a scenario of increased preoccupation with the harmful effects of ionizing radiation, and considering the opportunity to obtain the diagnosis of HS by means of the portal contrast-enhanced phase and the fact that such phase is the most useful in most abdominal CT indications(9,14,15), the possibility of confirming the value of contrast-enhanced CT in the screening for HS becomes particularly interesting. In an attempt to establish a criterion for diagnosis of HS by means of contrast-enhanced CT, Kim et al.(9) have proposed a mathematical equation considering the liver density in the portal vein and in the aorta. Such form of calculation tends to be less dependent in relation to potentially limiting factors, such as differences in injection velocity, amount, concentration or type of contrast medium, problems presented by previous studies with the same purposes.(10,15,16) As regards the previously utilized attenuation measurements(9), the authors of the present study proposed the utilization of a single measurement for each variable, thus simplifying the method and providing results similar to those obtained by the original authors. As the data regarding attenuation values in the liver, aorta and portal vein were entered into the Excel® worksheet, the results could be obtained in a pre-programmed and automatic manner; and such method is already being utilized by the residents in the authors' institution with good acceptance and results. New methods for analysis of the portal phase in the evaluation of HS are currently being studied, for example, the definition of areas with anomalous enhancement in the gallbladder fossa or in the peripheral zone of the hepatic segment IV, with 100% specificity in the diagnosis of HS(29). By combining such method with that proposed in the present study, its specificity would be incremented, increasing the value of the portal phase in the diagnosis of HS. Such combination of diagnostic criteria may be evaluated in future studies. The present study has a number of limitations. Because of its retrospective nature, it was not possible to assure that all the CT scans have rigorously followed the defined protocol and the calibration of the device for survey of the attenuation measurements. Additionally, the proportion of patients with HS was above the prevalence in the general population, and such a fact might have increased the positive predictive value of the method. The adopted reference standard for calculation of accuracy was not liver biopsy, but non-contrast-enhanced CT, a method known to be less effective than the histological analysis(4). On the other hand, several studies have adopted a similar method(9,10,1517) and the present study was not aimed at proposing a method of choice for non-invasive diagnosis of HS, but demonstrate that, with the portal phase, it is possible to identify patients with HS, without incurring in false negative results, which would allow avoiding the utilization of non-contrast-enhanced abdominal CT in routine investigations. However, for those patients under specific HS investigation, and with the purpose of quantifying the disease, the authors of the present study, like others, understand that MRI is the most effective method(4). With the obtained results, it is possible to conclude that abdominal CT in the portal phase provides useful data as a screening method for HS, as compared with the non-contrast-enhanced phase without contrast, being capable or ruling out the diagnosis of the disease with high sensitivity and high negative predictive value. On the other hand, the same assertion is not valid as regards the confirmation of the diagnosis of HS because of the low specificity of the method, with high rate of false-positive results. It is possible that the combination of criteria adopted with basis on the evaluation of the portal phase increases the specificity and accuracy of the method in the diagnosis of HS. REFERENCES 1. Qayyum A, Chen DM, Breiman RS, et al. Evaluation of diffuse liver steatosis by ultrasound, computed tomography, and magnetic resonance imaging: which modality is best? Clin Imaging. 2009;33:1105. 2. Ong JP, Younossi ZM. Epidemiology and natural history of NAFLD and NASH. Clin Liver Dis. 2007;11:116. 3. Lazo M, Clark JM. The epidemiology of nonalcoholic fatty liver disease: a global perspective. Semin Liver Dis. 2008;28:33950. 4. Ma X, Holalkere NS, Kambadakone RA, et al. Imaging-based quantification of hepatic fat: methods and clinical applications. Radiographics. 2009;29:125377. 5. Nikeghbalian S, Nejatollahi SM, Salahi H, et al. Does donor's fatty liver change impact on early mortality and outcome of liver transplantation. Transplant Proc. 2007;39:11813. 6. Perez-Daga JA, Santoyo J, Suárez MA, et al. Influence of degree of hepatic steatosis on graft function and postoperative complications of liver transplantation. Transplant Proc. 2006;38:246870. 7. Vauthey JN, Pawlik TM, Ribero D, et al. Chemotherapy regimen predicts steatohepatitis and an increase in 90-day mortality after surgery for hepatic colorectal metastases. J Clin Oncol. 2006;24:206572. 8. Tsang LL, Chen CL, Huang TL, et al. Preoperative imaging evaluation of potential living liver donors: reasons for exclusion from donation in adult living donor liver transplantation. Transplant Proc. 2008;40:24602. 9. Kim DY, Park SH, Lee SS, et al. Contrast-enhanced computed tomography for the diagnosis of fatty liver: prospective study with same-day biopsy used as the reference standard. Eur Radiol. 2010;20:35966. 10. Kodama Y, Ng CS, Wu TT, et al. Comparison of CT methods for determining the fat content of the liver. AJR Am J Roentgenol. 2007;188:130712. 11. Pickhardt PJ, Park SH, Hahn L, et al. Specificity of unenhanced CT for non-invasive diagnosis of hepatic steatosis: implications for the investigation of the natural history of incidental steatosis. Eur Radiol. 2012;22:107582. 12. Kalra MK, Maher MM, Toth TL, et al. Strategies for CT radiation dose optimization. Radiology. 2004;230:61928. 13. Wolbarst AB, Wiley AL Jr, Nemhauser JB, et al. Medical response to a major radiologic emergency: a primer for medical and public health practitioners. Radiology. 2010;254:66077. 14. Iannaccone R, Laghi A, Catalano C, et al. Hepatocellular carcinoma: role of unenhanced and delayed phase multi-detector row helical CT in patients with cirrhosis. Radiology. 2005;234:4607. 15. Jacobs JE, Birnbaum BA, Shapiro MA, et al. Diagnostic criteria for fatty infiltration of the liver on contrast-enhanced helical CT. AJR Am J Roentgenol. 1998;171:65964. 16. Johnston RJ, Stamm ER, Lewin JM, et al. Diagnosis of fatty infiltration of the liver on contrast enhanced CT: limitations of liver-minus-spleen attenuation difference measurements. Abdom Imaging. 1998;23:40915. 17. Panicek DM, Giess CS, Schwartz LH. Qualitative assessment of liver for fatty infiltration on contrast-enhanced CT: is muscle a better standard of reference than spleen? J Comput Assist Tomogr. 1997;21:699705. 18. Piekarski J, Goldberg HI, Royal SA, et al. Difference between liver and spleen CT numbers in the normal adult: its usefulness in predicting the presence of diffuse liver disease. Radiology. 1980;137:7279. 19. Speliotes EK, Massaro JM, Hoffmann U, et al. Liver fat is reproducibly measured using computed tomography in the Framingham Heart Study. J Gastroenterol Hepatol. 2008;23:8949. 20. Brunt EM. Pathology of fatty liver disease. Mod Pathol. 2007;20 Suppl 1:S408. 21. Hübscher SG. Histological assessment of non-alcoholic fatty livre disease. Histopathology. 2006;49:45065. 22. Castéra L, Hézode C, Roudot-Thoraval F, et al. Worsening of steatosis is an independent factor of fibrosis progression in untreated patients with chronic hepatitis C and paired liver biopsies. Gut. 2003;52:28892. 23. Fartoux L, Chazouillères O, Wendum D, et al. Impact of steatosis on progression of fibrosis in patients with mild hepatitis C. Hepatology. 2005;41:827. 24. Matsuoka MW, Oliveira IRS, Widman A, et al. Contribuição da ultrassonografia para o diagnóstico das alterações histopatológicas presentes na hepatite C crônica, com ênfase na esteatose hepática. Radiol Bras. 2011;44:1416. 25. Borges VF, Diniz ALD, Cotrim HP, et al. Dopplerfluxometria da veia hepática em pacientes com esteatose não alcoólica. Radiol Bras. 2011;44:16. 26. Burke LMB, Vachiranubhap B, Tannaphai P, et al. Contrast enhancement of liver lesions in cirrhotic patients: a single institution crossover comparative study of two MR contrast agents. Preliminary results. Radiol Bras. 2011;44:14750. 27. Sousa JPLBA, Bekhor D, Saito Filho CF, et al. Perfusão por tomografia computadorizada do abdome: aplicações clínicas, princípios e técnica do exame. Radiol Bras. 2012;45:3945. 28. Leão ARS, Sales DM, Santos JEM, et al. Avaliação do volume de fluxo portal em pacientes esquistossomóticos: estudo comparativo entre ressonância magnética e ultrassom Doppler. Radiol Bras. 2010;43:35561. 29. Lawrence DA, Oliva IB, Israel GM. Detection of hepatic steatosis on contrast-enhanced CT images: diagnostic accuracy of identification of areas of presumed focal fatty sparing. AJR Am J Roentgenol. 2012;199:447. 1. MDs, Residents, Department of Imaging Diagnosis, Escola Paulista de Medicina Universidade Federal de São Paulo (EPM-Unifesp), São Paulo, SP, Brazil. 2. MD, Radiologist, Fellow PhD degree, Department of Imaging Diagnosis, Escola Paulista de Medicina Universidade Federal de São Paulo (EPM-Unifesp), São Paulo, SP, Brazil. 3. Associate Professors, Department of Imaging Diagnosis, Escola Paulista de Medicina Universidade Federal de São Paulo (EPM-Unifesp), São Paulo, SP, Brazil. * Study developed at Department of Imaging Diagnosis, Escola Paulista de Medicina Universidade Federal de São Paulo (EPM-Unifesp), São Paulo, SP, Brazil. Mailing Address: Dr. Giuseppe D'Ippolito Departamento de Diagnóstico por Imagem EPM-Unifesp Rua Napoleão de Barros, 800, Vila Clementino São Paulo, SP, Brazil, 04024-002 E-mail: giuseppe_dr@uol.com.br Received October 30, 2012. Accepted after revision January 22, 2013. |
|
Av. Paulista, 37 - 7° andar - Conj. 71 - CEP 01311-902 - São Paulo - SP - Brazil - Phone: (11) 3372-4544 - Fax: (11) 3372-4554