Radiologia Brasileira - Publicação Científica Oficial do Colégio Brasileiro de Radiologia
AMB - Associação Médica Brasileira CNA - Comissão Nacional de Acreditação
 Vol. 46 nº 3 - May / June of 2013
|
WHICH IS YOUR DIAGNOSIS?
|
|
Which is your diagnosis? |
|
|
Autho(rs): Vitor Frauches Souza1; Renato Testahy Chaves1; Victor Spinelli Balieiro1; Caroline Bastida de Paula2; Alair Augusto Sarmet Moreira Damas dos Santos3; Marcelo Souto Nacif4 |
|
|
A female, 58-year-old patient with muscle pain in upper and lower limbs associated with mild dyspnea and bibasal stertor was referred to the imaging center to undergo high-resolution computed tomography (HRCT) (Figures 1, 2 and 3).
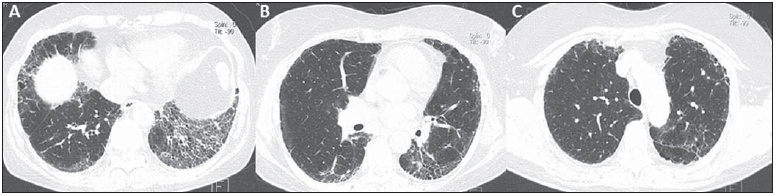 Figure 1. HRCT of the lower (A), middle (B) and upper (C) thirds of the lung. 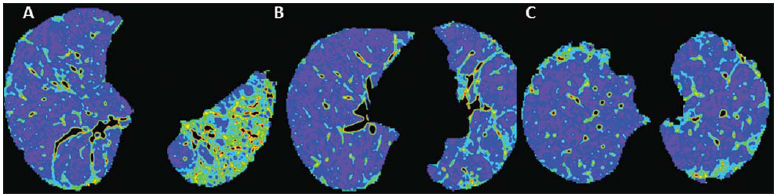 Figure 2. Color mapping on axial reformatting of lower (A), middle (B) and upper (C) thirds of the lung. 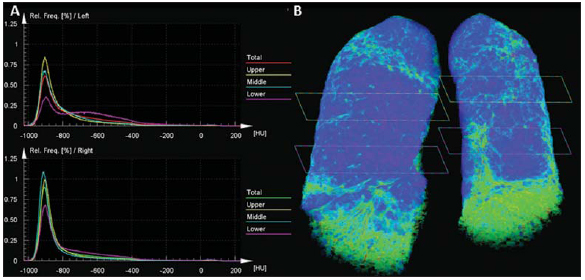 Figure 3. Evaluation of pulmonary density in the upper, middle and lower thirds of the lung (A) and 3D reformatting of the lungs with color mapping demonstrating the relative densities and planes of the upper, middle and lower thirds of the lung (B). IMAGES DESCRIPTION Figure 1. HRCT showing lower (A), middle (B) and upper (C) thirds of the lung with subtle pulmonary architectural distortion, peripheral reticulation and signs of fibrosis (honeycombing) intermingled with ground-glass attenuation and a relatively normal pulmonary parenchyma. Note the greater involvement of the lung bases where traction bronchiectasis is observed. Figure 2. Color mapping on axial reformatting of lower (A), middle (B) and upper (C) thirds of the lung, utilizing the Syngo InSpace Lung Parenchyma Analysis (Siemens) algorithms, where the qualitative (visual) analysis of the regions with higher density and increased dead space represented by the yellow/green colors. The dark blue tones represent areas of normal parenchyma where the gas exchange is still preserved. Figure 3. Pulmonary densities evaluation chart upper, middle and lower thirds of the lung (A) for quantitative analysis. 3D reformatting of the lungs with color mapping showing relative densities and the planes of the upper, middle and lower thirds of the lung (B). Initially, the software Syngo InSpace Lung Parenchyma Analysis (Siemens) facilitates the quantitative analysis based on the chart where the left lower basal region presents 50% less preserved parenchyma as compared with the ipsilateral upper region. By means of 3D reformatting, it is also possible to perform a qualitative analysis. Note that the right lung is less affected by the disease and is more expanded. Diagnosis: Qualitative and quantitative pulmonary density analysis in a patient with polymyositis and pulmonary fibrosis. COMMENTS Polymyositis is defined as an idiopathic myopathy which develops over weeks to months and whose main characteristic is the development of a nonsuppurative inflammatory process in the skeletal musculature, clinically manifesting as proximal and symmetrical muscle weakness. The incidence of such condition corresponds to one case per 100 thousand inhabitants, with predominance in women(1,2). Polymyositis may present either isolatedly or in association with systemic autoimmune diseases and viral infections such as lupus, rheumatoid arthritis, Crohn's disease, HIV and HTLV infections(3,4). In adult individuals, the polymyositis incidence peak occurs between 40 and 50 years, although individuals at any age may be affected(5). In 1975, Bohan & Peter developed classification criteria including(5,6): proximal and symmetrical muscle weakness; increased serum levels of muscle enzymes; electromyography with myopathic alterations; and characteristic alterations at muscle biopsy with absence of histological signs of other myopathies. The definitive diagnosis of polymyositis is established in the presence of the four above mentioned criteria. Three categories of myositis-specific autoantibodies are described. Among them, the anti-synthetase and anti-Jo-1 autoantibodies are strongly associated with interstitial lung disease. Pulmonary involvement and the consequential respiratory compromise are observed in only 10% of patients and may primarily occur either in the form of interstitial lung disease or by weakness of respiratory muscles(6,7). HRCT has allowed a great progress in the diagnosis and follow-up of these clinical situations. Computed tomography findings include those related to interstitial pneumonia which may be associated with fibrosing disorders with peripheral reticular pattern, bronchiectasis and traction bronchiectasis, honeycombing and minimal ground glass opacity, which usually present peripheral, basal and posterior predominance. However, some cases develop with an acute pattern of acute alveolar injury, such as in cases of systemic lupus erythematosus, where diffuse ground glass opacities, crazy paving and even consolidation, bilaterally(7). CT can demonstrate other findings generally related to esophageal dysmotility which might be suspected in the presence of esophageal dilatation or hypotonia with centrilobular nodules and predominance of consolidation in dependent pulmonary regions. On the other hand, elevation of the diaphragm with loss of lung volume occurs in cases where the diaphragmatic muscle is involved(7). The qualitative and quantitative analyses of the pulmonary density by means of dedicated softwares may be useful in the diagnosis and principally in the long-term follow-up of patients with chronic lung disease. Such softwares can create individual comparison standards, i.e., a first study may be utilized as a comparative basis for evaluation of an ongoing treatment or of groups, which might facilitate the definition of disease patterns and severity classification criteria according to the pulmonary parenchyma density percentage. In the present case, the authors demonstrated that the results can be stratified according to lung thirds (upper, middle and lower) to characterize the disease distribution. The mentioned software facilitates the three-dimensional automatic quantitative analysis of the mean, maximum and minimum pulmonary density, of the total lung volume and relative percentage volume. FINAL CONSIDERATIONS Advances in HRCT imaging and softwares for quantitative and qualitative evaluation of the lungs density facilitate the clinical and academic research because of their easy utilization and high reproducibility. The utilization of such softwares may transform the paradigms of follow-up of patients with interstitial lung disease. REFERENCES 1. Dalakas MC, Hohlfeld R. Polymyositis and dermatomyositis. Lancet. 2003;362:97182. 2. Yazici Y, Kagen LJ. Clinical presentation of the idiopathic inflammatory myopathies. Rheum Dis Clin North Am. 2002;28:82332. 3. Stefanidis I, Giannopoulou M, Liakopoulos V, et al. A case of membranous nephropathy associated with Sjögren syndrome, polymyositis and autoimmune hepatitis. Clin Nephrol. 2008;70:24550. 4. Robert WJ, William PA. Renal disorders associated with systemic sclerosis, rheumatoid arthritis, Sjögren's syndrome and polymyositis-dermatomyositis. In: Schrier RW, editor. Diseases of the kidney & urinary tract. 8th ed. Philadelphia, PA: Lippincott, Williams & Wilkins; 2007. p. 17134. 5. Miller ML. Clinical manifestations and diagnosis of adult dermatomyositis and polymyositis. UpToDate, 2008. 6. Betteridge Z, Gunawardena H, North J, et al. Antisynthetase syndrome: a new autoantibody to phenylalanyl transfer RNA synthetase (anti-Zo) associated with polymyositis and interstitial pneumonia. Rheumatology. 2007;46:10058. 7. Silva CIS, Müller NL. Manifestações intratorácicas das doenças do colágeno na tomografia computadorizada de alta resolução do tórax. Radiol Bras. 2008;41:18997. 1. Trainees in Radiology and Imaging Diagnosis at Instituto de Pós-Graduação Médica Carlos Chagas (IPGMCC), Rio de Janeiro, RJ, Brazil. 2. Application Specialist Siemens Healthcare, São Paulo, SP, Brazil. 3. Full Professor, Course of Radiology and Imaging Diagnosis, Instituto de Pós-Graduação Médica Carlos Chagas (IPGMCC), Rio de Janeiro, RJ, Coordinator, Imaging Center of Hospital de Clínicas de Niterói (HCN), Niterói, RJ, Brazil. 4. MD, Radiologist, Hospital de Clínicas de Niterói (HCN), Associate Professor, Department of Radiology, School of Medicine Universidade Federal Fluminense (UFF), Niterói, RJ, Brazil. Study developed at Hospital de Clínicas de Niterói (HCN), Niterói, RJ, Brazil. Mailing Address: Dr. Vitor Frauches Souza Rua Humberto de Campos, 746/301, Leblon Rio de Janeiro, RJ, Brazil, 22430-190 E-mail: drvitorfrauches@gmail.com |
|
GN1© Copyright 2025 - All rights reserved to Colégio Brasileiro de Radiologia e Diagnóstico por Imagem
Av. Paulista, 37 - 7° andar - Conj. 71 - CEP 01311-902 - São Paulo - SP - Brazil - Phone: (11) 3372-4544 - Fax: (11) 3372-4554
Av. Paulista, 37 - 7° andar - Conj. 71 - CEP 01311-902 - São Paulo - SP - Brazil - Phone: (11) 3372-4544 - Fax: (11) 3372-4554