Radiologia Brasileira - Publicação Científica Oficial do Colégio Brasileiro de Radiologia
AMB - Associação Médica Brasileira CNA - Comissão Nacional de Acreditação
 Vol. 43 nº 1 - Jan. /Feb. of 2010
|
ORIGINAL ARTICLE
|
|
Bone maturity: estimation by means of Eklof and Ringertz method simplifications |
|
|
Autho(rs): Celso Olivete Júnior, Evandro Luis Linhari Rodrigues |
|
|
Keywords: Bone age, Eklof and Ringertz, Carpal radiography |
|
|
Abstract:
IPhD in Electric Engineering, Escola de Engenharia de São Carlos - Universidade de São Paulo (EESC-USP), São Carlos, SP, Brazil
INTRODUCTION The human being is a dynamic biological species that, submitted to successive metabolic processes, evolves according to individual and environmental factors by means of mechanisms of growth and development. One may observe that the human body develops and grows according to its own sequences and rules whose different aspects have been studied(1). One of the methods for studying the growth is analyzing radiographic images of determined parts of the body, particularly the hands, since they can be most frequently and easily x-rayed, with no radiation being delivered to vital organs(1). The main clinical methods utilized for assessing the skeletal age are the following: Greulich & Pyle (GP) method that evaluates the hand bones by comparing radiographic images with an Atlas(1,2); Tanner & Whitehouse (TW) method, that analyses a set of twenty hand and wrist bones which are given specific scores according to sex, and by adding such scores, an overall maturity score is obtained(3-5); and the Eklof & Ringertz (ER) method based on measurements of ten ossification centers comprising carpal bones, width of the distal radial epiphyses, length and width of the capitates and hamate, length of the 2nd, 3rd and 4th metacarpal bones, and length of the 2nd and 3rd proximal phalanges(2,4). Such method comprises two tables, one for each sex where each of the ossification centers is given a minimum and a maximum standard measurement. The bone age is calculated by means of the mean age for each ossification center. A more detailed description of both these methods and estimation processes may be found at www.carpal.eesc.usp.br. Some studies with similar approaches may be found in the literature; among them the one developed by Taffarel et al.(5), who have developed a process for estimating bone age by means of the TW method automation. The study developed by Haiter et al.(6) was aimed at evaluating the possibility of applying the GP, TW and ER methods to the Brazilian population, defining which would be the most reliable one by comparing their results with the chronological age of the individuals. Considering the characteristics of each of the mentioned estimation methods, the authors have opted for exploring and implementing the ER method in the present study, since it is based on dimensional measurements, allowing the utilization of computational data processing. The present study presents a process for estimating bone age by means of automatic simplifications of the Eklof & Ringertz method denominated ER5 and ER3.
MATERIALS AND METHODS Study images Two sets of radiographic images of patients in the age range between six and 16 years were selected. The first set included images of 685 (357 male and 328 female) patients (Figure 1). The images were obtained at the Department of Odontology of Faculdade de Odontologia de Piracicaba - Universidade Estadual de Campinas (Unicamp), SP, Brazil, and were classified according to the GP and TW methods under the supervision of Prof. Francisco Haiter Neto, and according to the ER method with the aid of the Anacarp software(7) . The second set included of radiographic images of 234 (130 male and 104 female) patients of an institution in Bauru, SP, Brazil, given by Dr. Orivaldo Tavano(4). This second set of images was included in the study to allow the investigation of results considered as discrepant in relation to the mean values included in the clinical reports based on the ER, GP and TW methods applied to the first set of images.
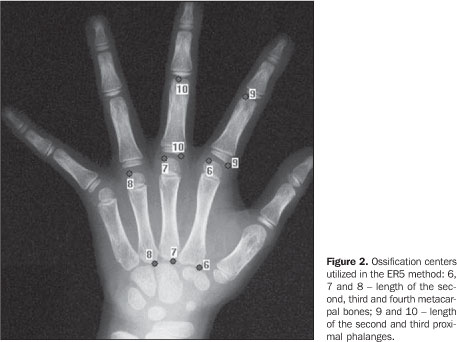
Methods The implementation of the method was developed in a Borland-Builder C++ environment, and the statistical analyses were performed with the software BioEstat 3.0(8). 1 -Proposals for ER method simplifications One of the difficulties found in the ER method is related to the overlapping between the carpal and wrist bones, hindering an accurate measurement of the regions of interest and, consequently, yielding unreliable results. In order to solve this problem, those bones were excluded from the estimation process and, as a result an ER method simplification emerged, being denominated ER5. a) The ER5 simplification In this simplified method, the bone age estimation is based on the analysis of only five ossification centers (ER5), including two proximal phalanges and three metacarpal bones, excluding the carpal and wrist bones (Figure 2).
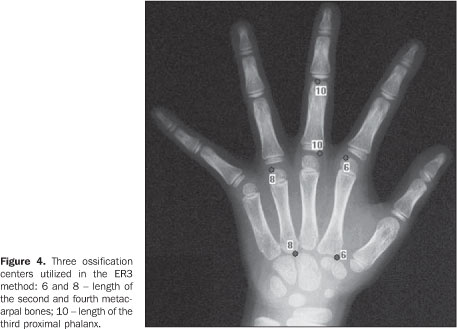
Later, a statistical analysis has led to a new simplification of the ER method resulting in the ER3 method. b) The ER3 simplification The authors aimed at finding the minimum number of ossification centers to achieve statistically significant results, i.e., similar to the mean values found on the clinical reports, establishing the highest possible number of combinations among the five bones (taken 2 by2, 3 by 3 and the mean value for the five bones) utilized in the ER5, and comparing them with the mean values found on the clinical reports. The denomination for the bones utilized in the combinations was the following: P1, P2 and P3 - 2nd, 3rd and 4th metacarpal bones length; P4 and P5 - 2nd and 3rd proximal phalanges length. Subsequently, charts were generated for each of the images of the set (Figure 3), analyzing which combinations were the most approximate to the value found on the clinical reports.
The dashed line with squares on the chart shown on Figure 3 corresponds to the mean value found on the clinical reports (ER, GP and TW). The points selected on the chart correspond to the combinations P1 P5 (circle marked with 1) and P1 P3 P5 (circle marked with 2). The mean value resulting from the combination (P1, P3 and P5 - formed by the bones highlighted on Figure 4) resulted in an excellent approximation to the mean value found on the clinical reports, indicating a simplification for the ER method.
2 -Method for estimating the bone age The steps of the bone age estimation process are shown on Figure 5.
1. Preprocessing - in order to eliminate the variations resulting from the non-uniformity of the image background inherent to the radiographic imaging process, the algorithm developed by Nascimento et al.(9) and presented in the study developed by Olivete et al.(10) was applied for correction of the heel effect with a low-pass filter to minimize the noises(11). 2. Bones segmentation - a simple way to achieve hand bones segmentation is an efficient thresholding method(11). The following methods were implemented: Otsu, Pun, Niblack and Rosenfeld(12-14) . 3. Separation of the ossification centers - In order to select the hand bones, the authors developed a process of scanning on the image, guided by the pixel with intensity 255 (background color). Later, markers were inserted to separate the 2nd, 3rd and 4th metacarpal bones and the 2nd and 3rd proximal phalanges. 4. Ossification centers measurements - Upon markers insertion, the length in pixels was calculated for each bone utilizing the Euclidean distance. The resulting value was converted into millimeters to be utilized with the ER method. 5. Bone age estimation - For each measurement found the table was searched for identification of the value corresponding to the age. The final age is found through the mean age obtained for all the ossification centers. 3 -Data analysis Bone ages were estimated with the aid of the Anacarp software(7); and later analyzed with the software BioEstat 3.0. Standard deviation, mean, correlation coefficient were calculated for the mean values of clinical reports (TW. GP and ER) and simplifications ER5 and ER3, and statistically analyzed by the Student's t-test. The Pearson's correlation was utilized with the objective of evaluating the correlation between the bone age calculated with the ER5 and ER3 methods and the mean values found on the clinical reports. The result of such analysis is the linear regression model Y = aX + b, where X corresponds to the mean value found on the clinical reports, Y to the estimated bone age, and a and b correspond to coefficients of this regression. For the calculation of the rate of agreement with the mean value found on the clinical reports, the coefficient a must be equal to 1, and the coefficient i must be equal to zero; so Y = X. The statistical significance was evaluated with the paired Student's t-test for the correlation coefficient, with a significance level of 5%.
RESULTS In order to improve the presentation and analysis of results, the images were classified according to the mean value found on the clinical reports, considering groups in the age range between six and 16 years where each age range comprises a number of individuals; for example the 6-year range includes individuals aged from 6 years to 6 years and 11 months. Table 1 demonstrates the results for male individuals. On Table 1, one can observe that the estimation performed for the male individuals by the ER5 method, demonstrated a strong and positive correlation with the mean values found on the clinical reports, ranging between 0.58 and 0.96. Based on the Student's t-test, only the results regarding the 11-year age group were not statistically significant, with p = 0.4512. In order to evaluate the usefulness of the simplified method ER5 in the bone age estimation for the male 11-year age group, 32 individuals with another set of images coming from another region of the country were selected, and the method was applied. The results were statistically significant (paired Student's t-test - p = 0.0076 and 72% correlation), demonstrating that the simplification can be applied to the 11-year age group. In order to understand the discrepancy observed in the first image bank, the 44 images whose results were not statistically significant were individually analyzed. Considering a standard deviation corresponding to 6 months - an acceptable value, since the standards defined by the classical methods range from 6 months to one year, depending on the age range -, only three individuals (7%) remained with non-statistically significant values. Thus, one may conclude that in the production of the clinical reports for the 11-year group of the first set of images, with two of the classical methods (GP and TW) that are performed with comparison procedures, it is possible that there was inaccuracy enough to generate values different from those expected for the clinical reports. Strong correlations were observed on the set of images of the male group, with the method ER5, with values achieving 97% and within the range of statistical significance (p < 0.05). Such significance was not observed only for the 9-year and 14-year groups. As the results of the 9-year group (a total of 28 images) are evaluated, two of them (7.14%) had ages estimates with differences of 7 and 8 months, respectively, in relation to the expected value (mean value found on the clinical reports). In the 14-year group, approximately 10% of the clinical reports presented values out of the 6-month standard deviation interval. The same comment on the 11-year group is also valid for the 14-year group, i.e., there is a high probability of inaccuracy in the production of the clinical reports with the classical methods (GP and TW) for the subjectivity implied in the interpretation of the images. Figure 6 presents a chart illustrating the correlations between mean values found on clinical reports (TW, GP and ER) and the method simplifications (ER5 and ER3), considering the age ranges in the male group. One can observe that the method simplifications presented a strong correlation (values > 0.5) almost in all age groups.
A similar analysis was undertaken for the female group whose results are shown on Table 2, demonstrating high and positive correlations with the mean value found on clinical reports, with values achieving approximately 91%. The worst result was observed for the 14-year group, with 0.5317 correlation and p = 0.2830 (higher than the 5% significance level). In this group, 31 images were evaluated and five bone age estimates (ranging between seven months and one year and two months) were different from the mean value found on the clinical reports, considering a standard deviation of 6 months. Table 2 also demonstrates non-statistically significant results for the 9-year and 10-year groups (p > 0.05). An individual analysis of the clinical reports of these age groups demonstrated that, for the 9-year group, 7.5% of the bone age estimates were different from the mean value observed on the clinical reports. On the other hand, for the 10-year group differences were observed in 3.7% of bone age estimates. In order to evaluate the statistical differences within these age ranges, the bone age estimation was repeated for the individuals whose images were included in the second set (Database II) - same age groups -, with results from the Pearson's correlation > 79% and p < 0.003 (Student's t-test) within the significance level.
DISCUSSION The methods traditionally utilized as reliable references in the process of bone age estimation are based on the analysis of carpal bone radiographs: GP, TW and ER. The first two methods require an inspectional comparative analysis, implying a significant level of subjectivity in the process. The ER method is one of the most frequently adopted in specialized centers that utilize computerized tools as an aid in the diagnosis. The utilization of this method presents some difficulties, among them the manual process for measuring the ossification centers requiring the insertion of 20 markers for identifying all the bones involved in the process(7,15). The authors have opted for exploring the ER method, considering that it is a standard method very frequently utilized the field of odontology(16). With the original method parameters the Anacarp tool was developed(7) to perform the bone age estimation in an automatic and simplified manner, differently from other softwares described in the literature that require manual operation(6,16), taking much time for inserting the 20 markers to identify all the ossification centers. With the Anacarp tool, the identification process is automatically and easily developed, with a high rate of agreement between results and the mean values found on clinical reports by the methods GP, TW and ER. The results were analyzed by means of the Pearson's correlation and the paired Student's t-test. The initial results were not statistically significant with p > 0.05 with the ER5 method for male individuals in the 11-year age group and female individuals in the 14-year age group, which has led to the utilization of a second image bank, allowing the conclusion that clinical reports generated with the GP and TW methods for the first image bank present values different from the ones expected for the clinical reports. The same observation is valid for the male individuals in the 9-year and 14-year age groups, and female individuals in the 9-year and 14-year age groups. The analyses for these age groups were repeated with individuals whose images were included in other image bank, and the reports generated by both methods for both male and female individuals were in agreement with the mean values found on clinical reports, considering a significance level of 5%. Individual analyses were performed in the image sets whose age estimates were out of the significance range, considering a standard deviation of 6 months as a reference in relation to the mean value found on clinical reports, with errors for both female and male groups ranging from 3.7% to 10%.
CONCLUSIONS Based on the results achieved in the bone age estimation process with the ER5 and ER3 simplifications for both female and male individuals of all the age groups, the authors observed positive and high correlation with the mean values found on the clinical reports that may be observed on the item "Correlation" on Tables 1 and 2, with values > 0.5000 (50% agreement). By observing the Student's t-test results, one can note that they were statistically significant, with p = 0.05 (see the item Student's t on Tables 1 and 2). Therefore, one can conclude that the ER method simplifications can be safely utilized in the bone age estimation, with significant results as compared with the mean values found on clinical reports, additionally to the advantage of automatic operation, contributing to the reduction of the subjectivity present in the classical methods and also offering an appropriate solution for bone age estimation on large databases.
REFERENCES 1. Haiter Neto F, Almeida SM, Leite CC. Estudo comparativo dos métodos de estimativa da idade óssea de Greulich & Pyle e Tanner & Whitehouse. Pesqui Odontol Bras. 2000;14:378-84. [ ] 2. Oliveira HW, Veeck EB, Souza PHC, et al. Avaliação radiográfica da idade óssea em crianças infectadas pelo HIV por via vertical. Radiol Bras. 2006;39:27-31. [ ] 3. Tanner JM, Whitehouse RH, Healy MJR. A new system for estimating skeletal maturity from the hand and wrist, with standards derived from a study of 2,600 healthy British children. Part II: The Scoring System. Paris: International Children's Centre; 1962. [ ] 4. Tavano O. Estudo das principais tabelas de avaliação da idade biológica, através do desenvolvimento ósseo, visando sua aplicação em brasileiros leucodermas da região de Bauru [tese de doutorado]. Bauru: Faculdade de Odontologia de Bauru - Universidade de São Paulo; 1976. [ ] 5. Taffarel B, Wangenhein AV, Silva PCA. Processamento de imagens para análise e estimativa de problemas de crescimento ósseo em crianças. III Workshop de Informática Aplicada à Saúde - CBComp 2003; Florianópolis, SC, Brasil; 2003. [ ] 6. Haiter-Neto F, Kurita LM, Menezes AV, et al. Skeletal age assessment: a comparison of 3 methods. Am J Orthod Dentofacial Orthop. 2006;130:435.e15-20. [ ] 7. Olivete CJ. Estimativa da idade óssea através da análise carpal baseada na simplificação do método de Eklof & Ringertz [dissertação de mestrado]. São Carlos: Departamento de Engenharia Elétrica - Universidade de São Paulo; 2005. [ ] 8. Ayres M. BioEstat. Versão 3.0. Belém: Sociedade Civil Mamirauá, MCT - CNPq; 2005. [acessado em 10 de fevereiro de 2009]. Disponível em: www.mamiraua.org.br [ ] 9. Nascimento MZ, Frere AF, Marques MA, et al. Subtraction of images for automatic determination of center of the radiation field. Engineering in Medicine and Biology Society. Proceedings of the 25th Annual International Conference of the IEEE. 2003;1:937-40. [ ] 10. Olivete CJ, Rodrigues ELL, Nascimento MZ. O efeito da correção do "efeito heel" em imagens radiográficas da mão. Rev Bras Fís Méd. 2005; 1:38-51. [ ] 11. Gonzalez RC, Woods RE. Digital image processing techniques. New York: Addison Wesley; 1993. [ ] 12. Otsu N. A threshold selection method from gray-level histograms. IEEE Trans Systems Man Cybernet. 1997;9:62-6. [ ] 13. Abutaleb AS. Automatic thresholding of gray-level pictures using two dimensional entropy. Comput Vision Graph Image Process. 1989;47:22-32. [ ] 14. Kapur JN, Sahoo PK, Wong AKC. A new method for gray-level picture thresholding using the entropy of the histogram. Comput Vision Graph Image Process. 1985;29:273-85. [ ] 15. Olivete CJ, Rodrigues ELL. Software automático para determinação da idade óssea baseado no método de Eklof & Ringertz. Rev Bras Fís Méd. 2009;2:15-9. [acessado em 25 de março de 2009]. Disponível em: http://www.abfm.org.br/rbfm/publicado/au_tra_72_p15-19.pdf [ ] 16. Duarte HEM, Viek R, Siqueira DF, et al. Avaliação das idades dentária e óssea em indivíduos situados antes do surto de crescimento puberal. Rev Ortodontia SPO. 2008;41:95-100. [ ] Received April 8, 2009. * Study developed at Escola de Engenharia de São Carlos - Universidade de São Paulo (EESC-USP), São Carlos, SP, Brazil. |
|

Av. Paulista, 37 - 7° andar - Conj. 71 - CEP 01311-902 - São Paulo - SP - Brazil - Phone: (11) 3372-4544 - Fax: (11) 3372-4554