Radiologia Brasileira - Publicação Científica Oficial do Colégio Brasileiro de Radiologia
AMB - Associação Médica Brasileira CNA - Comissão Nacional de Acreditação
 Vol. 41 nº 3 - May / June of 2008
|
ORIGINAL ARTICLE
|
|
Comparison of morphometric indices obtained from dental panoramic radiography for identifying individuals with osteoporosis/osteopenia |
|
|
Autho(rs): Celia Regina Winck Mahl, Renata Licks, Vania Regina Camargo Fontanella |
|
|
Keywords: Osteoporosis, Panoramic radiography, Risk factors |
|
|
Abstract:
IPhD, Associate Professor at Universidade Luterana do Brasil (Ulbra), Canoas, RS, Brazil
INTRODUCTION Osteoporosis is a progressive, systemic disease characterized by decreased bone mass resulting in deterioration of the bone microarchitecture, causing bones fragility and consequently increasing the risk for fractures(1). According to the World Health Organization (WHO)(2), 33% of women above the age of 65 years are affected by osteoporosis. In Brazil(3), it is estimated that about one million women may become disabled and at least 200 thousand will die from subsequent fracture-related complications in the next years, if this disease is not managed. So, osteoporosis starts being considered as a public health problem responsible for a considerable yearly expenditure(4,5). Considering that biopsy would be the most accurate method for detecting osteoporosis, bone densitometry has been consensually accepted as the golden standard in the diagnosis of osteoporosis(2); however, a systematic assessment of the population by this method has not been recommended. Patients are referred for examination on the basis of a clinical history positive for risk, postmenopausal fracture, familial history or use of pharmaceuticals(6). Several questionnaires have been developed and tested as tools for identifying patients with low bone density, with approximately 80% sensitivity and 50% specificity(7). Considering that odontological patients are frequently referred for being submitted to panoramic radiography — a widely available, low-cost method capable of demonstrating aging-related morphological alterations of the mandible —, several indices, techniques for analysis and images processing have been researched in order to evaluate the applicability of this type of radiography for detecting bone mass loss(8). However, the results of these studies have been contradictory. The present study was aimed at comparing mandibular cortical measurements based on panoramic radiographs with bone densitometry data of postmenopausal women to evaluate the effectiveness of these measurements in the identification of cases of osteopenia/osteoporosis.
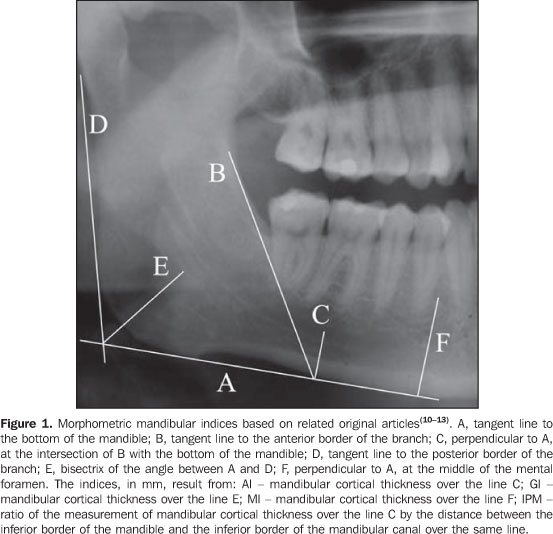
MATERIALS AND METHODS This observational and transversal study was approved by the Committee for Ethics in Research of the Institution (register No. 2005-236H). The sample included women > 40 years of age referred for evaluation by panoramic radiography for dental treatment purposes in 2006, who agreed in participating in the present study and met the following inclusion criteria: postmenopausal women with bone densitometry study performed for at last three months before, not undergoing hormone replacement or calcium therapy, who had not been submitted to hysterectomy or oophorectomy and free form osteoporosis-related metabolic diseases. Presence of bone lesion, fracture, deformity or previous mandibular surgery has also constituted exclusion criteria. The radiographic images were acquired in an Orthophos equipment (Siemens; Frankfurt, Germany) with kilovolt in the range between 65 kV and 80 kV and 16 mA, utilizing Kodak T-Mat (Kodak; São Paulo, Brazil) films processed in a DENT X 9000 (Dent X Co.; Elmsford, USA). Films with poor image quality were excluded from the sample with basis on previously defined criteria as follows: patient positioning errors, faults in density, contrast and detail(9). Each radiographic image was given an identification number in order to allow a blind review by two observers specialized in odontological radiology, with respectively 17- and two-year experience. The structures of interest were traced on transparencies placed on the radiographs and mounted in cardboard frames, over a negatoscope, with 0.25 mm Pigma Micron 1 (Sakura Corporation; Osaka, Japan). Measurements were bilaterally performed with an electronic, digital, 0.01 mm resolution pachimeter (Starrett; Jedburg, Scotland), on the transparency by the same observer (odontological radiologist). This procedure was repeated for all of the cases in the sample, with a two-week interval between readings. A second observer performed the same measurements in only one side of the images and in a single moment. Measurements (Figure 1) were aimed at obtaining the following radiomorphometric indices:
The radiographs were classified according to the mandibular cortical index (MCI)(14), qualitatively considering the endosteal margin of the mandibular cortex, as follows: C1 - normal (even and sharp endosteal margin); C2 - osteopenia (with semilunar defects); and C3 - osteoporosis (presence of porosity and reduced cortical thickness). The data were organized on a worksheet and the patients were classified according to the indices(10-13) for later comparison with the bone densitometry results, based on the WHO criteria(2), the t-score for osteopenia corresponding to a range between -1 and -2.5 standard deviation, and for osteoporosis, -2.5 standard deviation below the bone mass peak. In the cases where discrepancies were found in the bone densitometry study (spine and femur), the worst result was adopted. The intra- and interobserver reproducibility were evaluated by the Wilcoxon and t-Student (α = 1%) tests, the first one for the scores resulting from the MCI, and the second for the other indices. The same tests were utilized for evaluating the agreement between results for the right and left sides. Calculation of sensitivity, specificity, positive predictive and negative predictive values of the indices utilized for detection of bone mass loss, was based on the classification of the patients into normal or with bone mass loss, according to the bone densitometry results. Finally, the comparison among indices at the golden standard level, considering the three patients groups (normal, osteopenia and osteoporosis), the variance analysis (α = 1%) supplemented by the Tukey's test was utilized.
RESULTS Based on the bone densitometry results, the 49 patients included in the sample of the present study were classified as follows: 19 normal and 30 with bone mass loss (24 with osteopenia and six with osteoporosis) in the age range between 41 and 59 years (mean, 49.9 years), weighting between 59 kg and 75 kg (mean, 65.7 kg), and height in the range between 1.57 m and 1.74 m (mean, 1.63 m). The indices resulting from the two measurements by a same observer at different moments were compared by means of the t-Student test for paired samples, with no significant difference found between the two measurements, except for AI on the left side (p = 0.01). This difference may be considered as clinically irrelevant (0.09 mm). The non-parametric Wilcoxon test demonstrated no significant difference between the two classifications based on the MCI. The same statistical tests did not evidence any significant difference between measurements and scores attributed by both observers. The highest agreement between diagnoses utilizing the panoramic radiograph right and left sides was found for the GI, and the lowest for the MI (Table 1). The t-Student test for paired samples demonstrates that there is no significant difference (α = 1%) between measurements for both sides. The non-parametric Wilcoxon test did not demonstrate any significant difference between classifications based on the MCI for both sides.
Based on the mean between the two evaluations performed by the first observer adopting the worst diagnosis (left or right side) of each index, the patients were classified into normal or with bone mass loss (osteopenia and osteoporosis). Then, these diagnoses were compared with the bone densitometry results, and the sensitivity, specificity, positive predictive and negative predictive values of the indices utilized for detection of bone mass loss were calculated (Table 2).
Considering three groups (normal, osteopenia and osteoporosis) the variance analysis (Table 3) supplemented by the Tukey's test demonstrated that significant differences occurred among the three groups. For the PMI and MI, all the means were different among each other. On the other hand, for AI and GI, the normal group presented a higher mean than the other groups (osteopenia and osteoporosis) with no difference each other.
DISCUSSION There are evidences that the shape and mandibular cortical index at panoramic radiographs can be utilized as tools in the detection of low mineral bone density not for diagnosis purposes, but to identify the risk for bone mass loss and appropriately refer the patient for assessment by bone densitometry(15), allowing to prevent the development of the disease(16). Additionally, the role of clinical dentists in the identification of mandibular cortical erosion detected at panoramic radiographs of postmenopausal women results in 73% of correctness in the identification of low mineral bone density(17). In this sense, the results of the present study are promising. The analysis of repeated measurements reproducibility resulted in statistical difference only for the left side AI, but this difference is lower than 0.1 mm and may be associated with the manual method of measurement. Also the scores applied to the MCI were reproducible, notwithstanding being based on visual inspection and therefore theoretically subject to error. Both measurements and scores were also reproducible in relation to the sides and the observer. It is possible that also the surgeon dentist can identify patients at risk for bone mass loss when they seek odontological treatment(18). Besides the reproducibility, the validity of these indices, however, depends on their sensitivity and specificity as compared with the bone densitometry results(19). In the present study, the PMI presented the highest sensitivity, but its specificity was the lowest in the whole range of indices evaluated, almost 50% of the most specific index (MI). The MCI presented the worst results, in agreement with the findings of Knezoviƒ-Zlatariƒ et al.(20) and Devlin et al.(21). Upon analysis of Table 3, it is recommended that these indices are utilized as a whole, considering their simple application. As regards limitations of the present study, it is important to note that the bone densitometry studies were not performed in the same equipment, and that the dental condition of the patients was not taken into consideration as a variable. Also, it is important to note that even the patients under the age of 50 were classified by the t-score; the z-score was not utilized because the whole sample included postmenopausal women. The utilization of the new classification based on the z-score, according to Sampaio Netto et al.(22), leads to the lack of preoccupation with those patients considered as presenting with low mineral bone density according to the WHO criteria. Studies comparing all these indices in a single sample have not been frequently found in the literature. Comparing PMI, MI, AI, GI and MCI, bilaterally measured on panoramic radiographs of 94 women divided into three groups (normal, osteopenia and osteoporosis), Kim et al.(23) have concluded that the thickness and shape of the cortical mandible reliably reflect the systemic condition associated with bone mass loss. These results are similar to the ones of the present study. All of these indices could be utilized for differentiating between patients with normal and low bone mass density. Only two of these indices (PMI and MI) could differentiate between osteopenia and osteoporosis, likewise the conclusions reported by Devlin & Horner(24). Recently, Devlin et al.(21) recommended the utilization of MI values < 3 mm as a criterion for referral of patients for a bone densitometry study. In the present study, however, patients with osteoporosis have met this criterion. However, patients with osteopenia presented with higher MI values (mean, 3.53 mm). The indication of a specialized study for patients in this category would allow an early approach of this systemic condition that can b precociously prevented and treated. Therefore, it is important that the surgeon dentist is focused on the possibility of obtaining these indices and can evaluate their results to interact with other health professionals in the assessment of the risk for osteoporosis.
CONCLUSIONS The following conclusions can be drawn from the findings of the present study: - The indices evaluated were reproducible (< 0.1 mm variation) and did not varied as a function of the observer or the side where the measurement was performed; - the PMI and MI presented the highest sensitivity for detecting bone mass loss, but the MPI specificity was low; - all the indices evaluated in the present study could identify a low bone mass density, but only the PMI and MI could differentiate between patients with osteopenia and osteoporosis.
REFERENCES 1. Consensus Development Conference: diagnosis, prophylaxis and treatment of osteoporosis. Am J Med. 1993;94:646-50. [ ] 2. World Health Organization. Assessment of fracture risk and its applications to screening for postmenopausal osteoporosis. WHO Technical Series 843,1994. [ ] 3. IBGE, 2006. Pesquisa nacional por amostra de domicílios. [Acessado em: 17/11/2006]. Disponível em http://www.ibge.gov.br/home/estatistica/populacao/trabalhoerendimento/pnad98/ saude/metodologia.shtm [ ] 4. Mohajery M, Brooks SL. Oral radiographs in the detection of early signs of osteoporosis. Oral Surg Oral Med Oral Pathol. 1992;73:112-7. [ ] 5. Tolazzi AL. Osteoporose relacionada com a odontologia [dissertação de mestrado]. São Paulo: Universidade de São Paulo; 2001. [ ] 6. Dargent-Molina P, Piaults S, Bréart G. A triage strategy based on clinical risk factors for selecting elderly women for treatment or bone densitometry: the EPIDOS prospective study. Osteoporos Int. 2005;16:898-906. [ ] 7. Schwartz EN, Steinberg DM. Prescreening tools to determine who needs DXA. Curr Osteoporos Rep. 2006;4:148-52. [ ] 8. White S, Taguchi A, Kao D, et al. Clinical and panoramic predictors of femur bone mineral density. Osteoporos Int. 2005;16:339-46. [ ] 9. Brezden NA, Brooks SL. Evaluation of panoramic dental radiographs taken in private practice. Oral Surg Oral Med Oral Pathol. 1987;63:349-56. [ ] 10. Benson BW, Prihoda TJ, Glass BJ. Variations in adult cortical bone mass as measured by a panoramic mandibular index. Oral Surg Oral Med Oral Pathol. 1991;71:617-21. [ ] 11. Ledgerton D, Horner K, Devlin H, et al. Panoramic mandibular index as a radiomorphometric tool an assessment of precision. Dentomaxillofac Radiol. 1997;26:95-100. [ ] 12. Ledgerton D, Horner K, Devlin H, et al. Radiomorphometric indices of the mandible in a British female population. Dentomaxillofac Radiol. 1999;28:173-81. [ ] 13. Bras J, Van Ooij CP, Abraham-Inpijn L, et al. Radiographic interpretation of the mandibular angular cortex: a diagnostic tool in metabolic bone loss. Part I. Normal state. Oral Surg Oral Med Oral Pathol. 1982;53:541-5. [ ] 14. Klemetti E, Kolmakov S, Kroger H. Pantomography in assessment of the osteoporosis risk group. Scand J Dent Res. 1994;102:68-72. [ ] 15. Dervis E. Oral implications of osteoporosis. Oral Surg Oral Med Oral Pathol Oral Radiol Endod. 2005;100:349-56. [ ] 16. Ardakani FE, Niafar N. Evaluation of changes in the mandibular angular cortex using panoramic images. J Contemp Dent Pract. 2004;5:1-5. [ ] 17. Sutthiprapaporn P, Taguchi A, Nakamoto T, et al. Diagnostic performance of general dental practitioners after lecture in identifying post-menopausal women with low bone mineral density by panoramic radiographs. Dentomaxillofac Radiol. 2006;35:249-52. [ ] 18. Musa I, Knezović-ZlatarićD, ČelebićA, et al. The influence of gender and age on the values of linear radiomorphometric indices measured on the lower border of the mandible. Acta Stomatol Croat. 2002;36:199-202. [ ] 19. Kribbs PJ, Chesnut CH, Ott SM, et al. Relationships between mandibular and skeletal bone in a population of normal women. J Prosth Dent. 1990;63:86-9. [ ] 20. Knezović-ZlatarićD, ČelebićA, LazićB, et al. Influence of age and gender on radiomorphometric indices of the mandible in removable denture wearers. Coll Antropol. 2002;26:259-66. [ ] 21. Devlin H, Karayianni K, Mitsea A, et al. Diagnosing osteoporosis by using dental panoramic radiographs: the OSTEODENT project. Oral Surg Oral Med Oral Pathol Oral Radiol Endod. 2007. doi:10.1016/j.tripleo.2006.12.027 [ ] 22. Sampaio Netto O, Coutinho LOL, Souza DC. Análise da nova classificação de laudos de densitometria óssea. Radiol Bras. 2007;40:23-5. [ ] 23. Kim JY, Nah KS, Jung YH. Comparison of panorama radiomorphometric indices of the mandible in normal and osteoporotic women. Korean J Maxillofac Radiol. 2004;34:69-74. [ ] 24. Devlin H, Horner K. Mandibular radiomorphometric indices in the diagnosis of reduced skeletal bone mineral density. Osteoporos Int. 2002; 13:373-8. [ ] Received March 20, 2007. Accepted after revision September 5, 2007. * Study developed at Universidade Luterana do Brasil (Ulbra), Canoas, RS, Brazil. |
|

Av. Paulista, 37 - 7° andar - Conj. 71 - CEP 01311-902 - São Paulo - SP - Brazil - Phone: (11) 3372-4544 - Fax: (11) 3372-4554