Radiologia Brasileira - Publicação Científica Oficial do Colégio Brasileiro de Radiologia
AMB - Associação Médica Brasileira CNA - Comissão Nacional de Acreditação
 Vol. 51 nº 1 - Jan. /Feb. of 2018
|
ORIGINAL ARTICLE
|
|
Myocardial T1 mapping and determination of partition coefficients at 3 tesla: comparison between gadobenate dimeglumine and gadofosveset trisodium |
|
|
Autho(rs): Marcelo Souto Nacif1; Fabio S. Raman2; Neville Gai3; Jacquin Jones4; Rob J. van der Geest5; Christopher T. Sibley3; Songtao Liu3; David A. Bluemke6 |
|
|
Keywords: Gadolinium; Gadolinium DTPA; Contrast media; Organometallic compounds; Magnetic resonance imaging/methods; Myocardium/pathology. |
|
|
Abstract: INTRODUCTION
The introduction of gadofosveset trisodium into clinical use has created interesting prospects for its use in cardiac studies. Gadofosveset is characterized by transient, reversible, noncovalent binding to serum albumin because of a specific lipophilic side chain(1). That results in slower renal excretion than that observed with standard extracellular gadolinium chelates(2,3). To date, the primary clinical application of gadofosveset has been in aortic magnetic resonance (MR) angiography(4). The use of gadofosveset in coronary MR angiography has recently been investigated, because the technique typically has a low signal-tonoise ratio when applied without contrast(59). Recently, gadofosveset has been used in the detection of myocardial scar(10), on the basis of late gadolinium enhancement (LGE). The evaluation of myocardial tissue composition can be important in certain contexts, such as in association with coronary angiography. Therefore, it is important to understand the relative longitudinal (T1) relaxation times of the blood pool and myocardium after gadolinium contrast agent administration. Quantification of myocardial and blood pool T1 times has been of particular interest not only for the detection of focal scar but also for identification of diffuse interstitial fibrosis(1113). Diffuse myocardial fibrosis can lead to heart failure and is strongly associated with several cardiac risk factors and conditions, including diabetes, hypertension, hypertrophy, and even aging(12,13). Myocardial T1 times are commonly measured using a modified look-locker inversion recovery (MOLLI) pulse sequence; absolute T1 times can be expressed(1416), or the partition coefficient can be calculated to reflect the distribution of the contrast agent between the blood and myocardial tissue(1719). To date, T1 mapping by cardiac magnetic resonance (CMR) with MOLLI pulse sequences has not been used to derive myocardial T1 times in individuals receiving gadofosveset trisodium. Therefore, we sought to compare an albumin-bound gadolinium chelate (gadofosveset trisodium) and an extracellular contrast agent (gadobenate dimeglumine), in terms of their effects on myocardial T1 time and partition coefficients. MATERIALS AND METHODS Study population This study was approved by our institutional review board. All participating subjects provided written informed consent and completed two CMR studies. Between October 2011 and February 2012, a total of 25 healthy volunteers were enrolled. The inclusion criteria for study subjects were that they were free of cardiovascular symptoms, had no history of infection in the last 4 weeks before the CMR exam, and had no history of clinical cardiovascular risk factors, including diabetes, smoking, hypertension, hyperlipidemia, and cerebrovascular or peripheral arterial disease. Subjects in whom CMR studies were contraindicated, such as those with claustrophobia or metallic implants, were excluded, as were those who were unable to follow instructions for breath holding and those in whom a scar was identified on LGE imaging. Levels of hematocrit and serum creatinine were determined at 24 h before the CMR studies, as was the estimated glomerular filtration rate. Height, weight, heart rate, systolic blood pressure, diastolic blood pressure, and contrast dose were also recorded. CMR protocol All studies were conducted in two separate sessions in a 3T scanner (Verio; Siemens Medical Solutions, Erlangen, Germany) and a 32-channel cardiac array coil (Invivo, Orlando, FL, USA). Study subjects underwent steady-state free precession cine-MR and phase-sensitive inversion recovery LGE imaging at 15 min post-injection for myocardial scar detection. Inversion times were individually adjusted to null the signal from the normal myocardium(20). A MOLLI pulse sequence, as described previously(21), was used in order to obtain one pre-contrast T1 map and two post-contrast T1 maps in the mid-ventricular short axis plane during diastole. In brief, the scan parameters were as follows: 8 images with different inversion times; repetition time/echo time, 2.4/1.03 ms; flip angle, 35°; bandwidth, 1002 Hz/pixel; minimum inversion time, 125 ms; inversion time increment, 80 ms; slice thickness, 8 mm; integrated parallel acquisition technique (generalized autocalibrating partially parallel acquisition) factor, 2; total scan time, 11 RR intervals. The order of contrast administration was randomly varied, an injection of either gadobenate dimeglumine (0.1 mmol/kg, 2 mL/s; Bracco Diagnostics, Princeton, NJ, USA) or gadofosveset trisodium (0.03 mol/kg, 0.66 mL/s; Lantheus Medical Imaging, North Billerica, MA, USA) being followed by a 20 mL saline bolus administered at the same flow rate. To calculate the dose of gadofosveset, we used the formula provided on the website of the supplier (http://www.ablavar.com/dosage.html). After a mean interval of 30 ± 5 days, the same subjects underwent the same MR protocol with the other contrast agent. Ten subjects were randomly selected to participate in the evaluation of the kinetics/washout of both contrast agents from minute 5 to minute 45, at 3-min intervals. CMR analysis One observer (observer 1) analyzed the CMR data, and another (observer 2) performed reproducibility studies. Left ventricular end-diastolic volume, end-systolic volume, mass, and ejection fraction were evaluated using semi-automated 3D model-based software (CIM 6.2; MRI Research Group, University of Auckland, New Zealand), as described previously(22). Myocardial scar was defined as visually present or absent after a delay of 15 min on LGE; none of the study subjects had focal LGE. The T1 was measured twice by the same observer, and the average value was used for analysis. MOLLI image sets were calculated using an MR map, and motion correction was performed when necessary(23). For extraction of the mean myocardial and blood pool T1 values, endocardial, epicardial, and blood pool contours were manually traced on all T1 maps using MASS research software, version 2012EXP (Leiden University Medical Center, Leiden, the Netherlands). All acquisition times were normalized to 12 min and 25 min for time point comparisons(24). The partition coefficient was calculated as the slope of the linear relationship between the longitudinal relaxation rate (R1) for the myocardium (dependent variable) and the R1 for the blood pool (predictor variable) for all measurements taken before and after contrast administration(25). Although gadofosveset might not diffuse freely between the intravascular and extravascular compartments, the extracellular volume fraction (ECV) was calculated, for the purposes of comparison with gadobenate, as follows(21) : ECV = ΔR1myocardium/ΔR1blood)*(1 − Hct) where Hct is the hematocrit, and ΔR1 is the change in relaxivity, calculated as follows: ΔR1 = ΔR1post gadolinium − ΔR1pre gadolinium Statistical analysis Statistical analysis was performed with the Stata statistical software package, version 12.0 (StataCorp LP; College Station, TX, USA) and an Excel plug-in (Daniels XL Toolbox, version 4.01; Free Software Foundation, Boston, MA, USA). Values of p < 0.05 were considered significant. Data are presented as mean ± standard deviation for continuous variables and as absolute and relative frequencies for categorical variables. Paired Students t-tests were used in order to identify significant differences between the two contrast agents. Multiple comparisons were tested by one-way analysis of variance with post-hoc Bonferroni correction. Due to patient and technologist variability, the average post-contrast MOLLI acquisition times were 15 min and 21 min; correction to standardized delay times of 12 and 25 min was performed with a multicompartmental model, the kinetic parameters of which were obtained from acquired gadofosveset trisodium data and corrected as previously described(24). After correction, the average difference between myocardial and blood T1 values was small (less than 0.2% for gadobenate and 1.6% for gadofosveset). Bland-Altman plots were used in order to describe the difference in T1 values between gadobenate dimeglumine and gadofosveset trisodium. We used exponential regression analysis to compare the slopes (β) of the washout curves. Ten (47.6%) of the 21 subjects were randomly chosen to undergo measurements performed by a second independent observer in order to assess interobserver variability. Intraobserver and interobserver agreement were assessed on the basis of the intraclass correlation coefficient (ICC), with a two-way random effects model (ICC < 0.40 = poor; ICC ≥ 0.400.75 = fair to good; and ICC > 0.75 = excellent). RESULTS The average CMR study duration was 39 ± 6 min. Four subjects were excluded, for the following reasons: the images acquired being of extremely poor quality (n = 2); not returning for the second scan (n = 1); and being claustrophobic (n = 1). Two subjects experienced nausea after contrast administrationof gadobenate dimeglumine in one case and of gadofosveset trisodium in the other. Therefore, a total of 21 healthy subjects (mean age, 27.9 ± 6.7 years; 8 males) were included for analysis. All subjects showed a normal ejection fraction on cine-MR images and no myocardial scar on LGE images. There were no significant differences between the two study visits in terms of the clinical and imaging parameters. Subject characteristics are summarized in Table 1. A total of 252 myocardial and blood pool T1 values were obtained for the 21 subjects, at one pre-contrast time point and at two post-contrast time points. 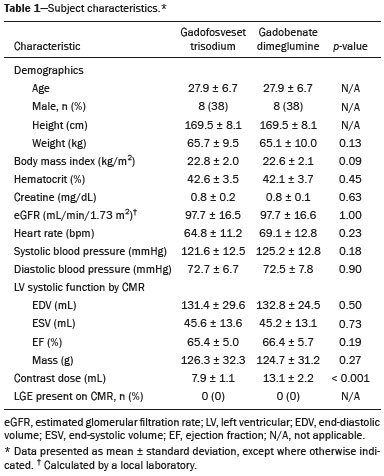 After gadolinium administration, the mean difference between gadobenate and gadofosveset for myocardial T1 times (in a paired comparison) was −7.6 ± 60 ms (i.e., gadobenate T1 < gadofosveset T1; p = 0.41). For blood pool T1 times, the mean difference (in a paired comparison) was 56.5 ± 67 ms (i.e., gadobenate T1 > gadofosveset T1; p < 0.001). Figure 1 shows the Bland-Altman analysis of the myocardial and blood pool T1 values for the two contrast agents, using MOLLI. 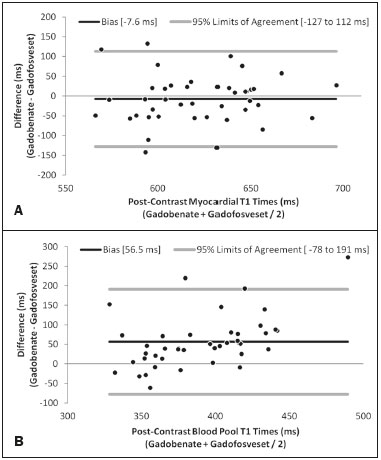 Figure 1. Bland-Altman analysis comparing gadobenate and gadofosveset. The mean difference (bias) is represented by the black line, and the 95% limits of agreement are represented by the gray lines. A: Myocardial. B: Blood pool. The partition coefficient (expressed as λ) was higher for gadobenate (λ = 0.41) than for gadofosveset (λ = 0.33), indicating that the blood pool washout was slower for the latter. Similarly, the mean ECV was significantly lower for the intravascular contrast agent gadofosveset than for the extracellular contrast agent gadobenate (22 ± 2.3% [range, 18.326%] vs. 24 ± 1.7% [range, 20.126.9%]; p = 0.004). Figure 2 shows the relationship between the blood pool and the myocardium, before and after the administration of each contrast agent, in terms of the R1 values. For both contrast agents, the intraobserver and interobserver agreement was excellent for the myocardial and blood pool T1 values, as well as for the partition coefficient and myocardial ECV, with ICC values of 0.980.99 (Table 2). 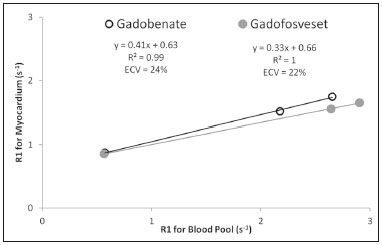 Figure 2. The relationship between the blood pool and the myocardium in terms of the R1 values before and after gadolinium administration. The slope of this relationship is the partition coefficient (λ). The slope was steeper for gadobenate (open black circle) than for gadofosveset (gray circle). This was also reflected in the ECV, which was greater for gadobenate than for gadofosveset. 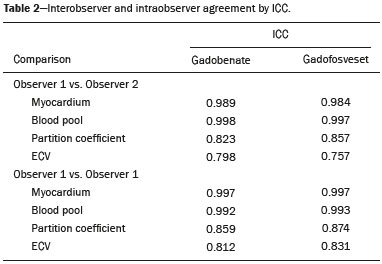 Figure 3 shows the relationships among the T1, R1, ΔR1, and ECV for normal myocardium and for the blood pool over the entire time period (545 min) after contrast injection. In the exponential analysis of myocardial T1 times, the washout rate was found to be lower for gadofosveset than for gadobenate (p < 0.001). The blood pool T1 times showed a similar behavior in the washout curve (p < 0.001). 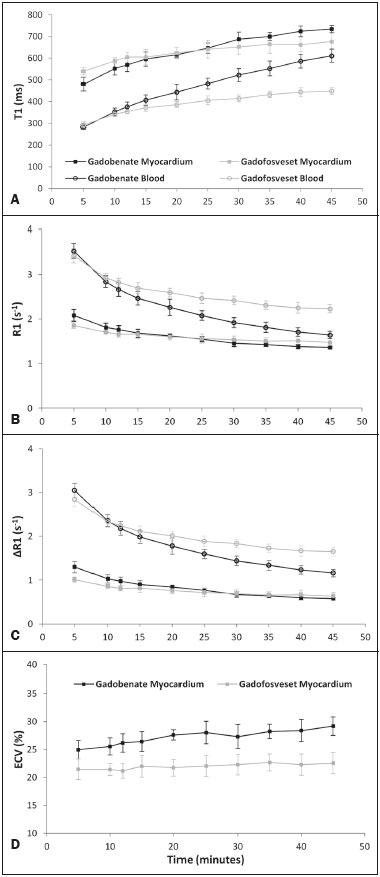 Figure 3. The relationship among T1 (A), R1 (B), ΔR1 (C), and ECV (D) in normal myocardium (squares) and the blood pool (white circles) over time (545 min) after injection of gadobenate (black lines) and gadofosveset (gray lines), in healthy volunteers. DISCUSSION Eight different gadolinium-based MRI contrast agents have been approved for human studies in the United States(26). Although most contrast agents have been used interchangeably to assess myocardial LGE, much less information is available regarding diffuse myocardial fibrosis identified through T1 mapping. A first step in this regard is to understand the differences between contrast agents in healthy volunteers. In this study, we demonstrated that myocardial T1 times did not differ significantly between a primary intravascular contrast agent (gadofosveset) and an extracellular agent (gadobenate) at typical clinical doses. However, the partition coefficients and ECV were slightly lower for gadofosveset than for gadobenate. That is consistent with prolonged intravascular retention of the former. The routine application of any type of contrast is mainly dependent on the overall advantages and usefulness of clinically indicated protocols. For heart studies, the evidence suggests that gadofosveset is better for the evaluation of the coronary artery and veins(69,27,28). In addition, the evaluation of perfusion at rest(29,30) and myocardial infarction(10) have been demonstrated to constitute a feasible alternative. Nevertheless, when gadofosveset is used in complete CMR protocols for the evaluation of coronary artery disease, it will also be necessary to assess diffuse myocardial fibrosis. Myocardial T1 mapping has been used in order to detect focal or diffuse myocardial fibrosis(11,12,15). However, there have been few studies using that technique to evaluate the influence of different contrast agents, delayed acquisition, field strength, and cardiac cycle(31). In a study of the relationship between gadopentetate dimeglumine (Gd-DTPA, 0.15 mmol/kg) and gadobenate dimeglumine (0.1 mmol/kg), only a few differences were found between the two(32). It remains unknown how such differences will affect the assessment of patients with diseases in multicenter trials or, if applicable, patient management when different contrast agents are used; neither is it known whether small (< 5%) differences will affect their use in clinical practice. Stratification by class and not by continuous variables (T1 time in ms or ECV in %) might be the best way to differentiate the normal population from that with subclinical or clinical illness. In this preliminary study, we attempted to understand the differences between two contrast agents in healthy volunteers, using T1 mapping. It was initially important to understand that, after intravenous injection, a significant portion (79.887.4%) of circulating gadofosveset is bound to plasma proteins, resulting in some extravascular distribution of the agent. The recommended single dose of gadofosveset trisodium (0.03 mmol/kg) has a mean half-life during the elimination phase of 16.3 ± 2.6 h. For gadobenate, the aromatic ring enables weak plasma protein binding, resulting in a higher relaxivity in plasma/blood than for the more routinely used Gd-DTPA contrast agents(2,3337), although the same has not been found for gadofosveset. A single 0.1 mmol/kg dose of gadobenate has a mean halflife of 2.02 ± 0.60 h during the elimination phase(3537). In other studies comparing these distinct dynamic contrast agents (gadobenate and gadofosveset) in terms of their impact on the assessment of myocardial perfusion, no significant differences were found between the two(29). Myocardial T1 relaxation times and ECV have not previously been evaluated in individuals undergoing imaging studies involving the use of gadofosveset(31,32). In the present study, myocardial T1 times did not differ significantly between the subjects receiving standard clinical doses of gadobenate and those receiving standard clinical doses of gadofosveset. The variation in ECV over time is assumed to be stable when a two-compartment model is used(3840). A steady-state stage between the intravascular and interstitial compartments has supposedly been established(33,41,42). However, the ECV for gadobenate increases over time, whereas the ECV for gadofosveset is more stable (Figure 3D). This study has several limitations. We used 3T scanners and evaluated young healthy subjects. The pharmacokinetics might have been different had we included subjects with renal dysfunction or older subjects. In addition, we compared the recommended doses, rather than the equimolar doses, of the two contrast agents analyzed. In conclusion, myocardial T1 times do not differ significantly between gadofosveset and gadobenate. However, when the two contrast agents were administered at typical clinical doses, the partition coefficients and ECV are significantly lower for the intravascular contrast agent (gadofosveset) than for the extracellular contrast agent (gadobenate). REFERENCES 1. Lauffer RB, Parmelee DJ, Dunham SU, et al. MS-325: albumintargeted contrast agent for MR angiography. Radiology. 1998;207:52938. 2. Rohrer M, Bauer H, Mintorovitch J, et al. Comparison of magnetic properties of MRI contrast media solutions at different magnetic field strengths. Invest Radiol. 2005;40:71524. 3. Bock M, Schulz J, Ueltzhoeffer S, et al. Intravascular contrast agent T1 shortening: fast T1 relaxometry in a carotid volunteer study. MAGMA. 2008;21:3638. 4. Shamsi K, Yucel EK, Chamberlin P. A summary of safety of gadofosveset (MS-325) at 0.03 mmol/kg body weight dose: phase II and phase III clinical trials data. Invest Radiol. 2006;41:82230. 5. Wagner M, Rief M, Asbach P, et al. Gadofosveset trisodium-enhanced magnetic resonance angiography of the left atriuma feasibility study. Eur J Radiol. 2010;75:16672. 6. Prompona M, Cyran C, Nikolaou K, et al. Contrast-enhanced whole-heart coronary MRA using gadofosveset 3.0 T versus 1.5 T. Acad Radiol. 2010;17:86270. 7. Prompona M, Cyran C, Nikolaou K, et al. Contrast-enhanced whole-heart MR coronary angiography at 3.0 T using the intravascular contrast agent gadofosveset. Invest Radiol. 2009;44:36974. 8. Kelle S, Thouet T, Tangcharoen T, et al. Whole-heart coronary magnetic resonance angiography with MS-325 (gadofosveset). Med Sci Monit. 2007;13:CR469474. 9. Stuber M, Botnar RM, Danias PG, et al. Contrast agent-enhanced, free-breathing, three-dimensional coronary magnetic resonance angiography. J Magn Reson Imaging. 1999;10:7909. 10. Thouet T, Schnackenburg B, Kokocinski T, et al. Visualization of chronic myocardial infarction using the intravascular contrast agent MS-325 (gadofosveset) in patients. ScientificWorldJournal. 2012;2012:236401. 11. Iles L, Pfluger H, Phrommintikul A, et al. Evaluation of diffuse myocardial fibrosis in heart failure with cardiac magnetic resonance contrast-enhanced T1 mapping. J Am Coll Cardiol. 2008;52:157480. 12. Mewton N, Liu CY, Croisille P, et al Assessment of myocardial fibrosis with cardiovascular magnetic resonance. J Am Coll Cardiol. 2011;57:891903. 13. Ugander M, Oki AJ, Hsu LY, et al. Extracellular volume imaging by magnetic resonance imaging provides insights into overt and subclinical myocardial pathology. Eur Heart J. 2012;33:126878. 14. Dall'Armellina E, Piechnik SK, Ferreira VM, et al. Cardiovascular magnetic resonance by non contrast T1-mapping allows assessment of severity of injury in acute myocardial infarction. J Cardiovasc Magn Reson. 2012;14:15. 15. Nacif MS, Turkbey EB, Gai N, et al. Myocardial T1 mapping with MRI: comparison of look-locker and MOLLI sequences. J Magn Reson Imaging. 2011;34:136773. 16. Messroghli DR, Radjenovic A, Kozerke S, et al. Modified look-locker inversion recovery (MOLLI) for high-resolution T1 mapping of the heart. Magn Reson Med. 2004;52:1416. 17. Thornhill RE, Prato FS, Wisenberg G, et al. Feasibility of the singlebolus strategy for measuring the partition coefficient of Gd-DTPA in patients with myocardial infarction: independence of image delay time and maturity of scar. Magn Reson Med. 2006;55:7809. 18. Thornhill RE, Prato FS, Wisenberg G, et al. Determining the extent to which delayed-enhancement images reflect the partition-coefficient of Gd-DTPA in canine studies of reperfused and unreperfused myocardial infarction. Magn Reson Med. 2004;52:106979. 19. Kawel N, Nacif M, Santini F, et al. Partition coefficients for gadolinium chelates in the normal myocardium: comparison of gadopentetate dimeglumine and gadobenate dimeglumine. J Magn Reson Imaging. 2012;36:7337. 20. Kellman P, Arai AE, McVeigh ER, et al. Phase-sensitive inversion recovery for detecting myocardial infarction using gadolinium-delayed hyperenhancement. Magn Reson Med. 2002;47:37283. 21. Lee JJ, Liu S, Nacif MS, et al. Myocardial T1 and extracellular volume fraction mapping at 3 tesla. J Cardiovasc Magn Reson. 2011;13:75. 22. Young AA, Cowan BR, Thrupp SF, et al Left ventricular mass and volume: fast calculation with guide-point modeling on MR images. Radiology. 2000;216:597602. 23. Messroghli DR, Rudolph A, Abdel-Aty H, et al. An open-source software tool for the generation of relaxation time maps in magnetic resonance imaging. BMC Med Imaging. 2010;10:16. 24. Gai N, Turkbey EB, Nazarian S, et al. T1 mapping of the gadolinium-enhanced myocardium: adjustment for factors affecting interpatient comparison. Magn Reson Med. 2011;65:140715. 25. Broberg CS, Chugh SS, Conklin C, et al. Quantification of diffuse myocardial fibrosis and its association with myocardial dysfunction in congenital heart disease. Circ Cardiovasc Imaging. 2010;3:72734. 26. Nacif MS, Arai AA, Lima JA, et al. Gadolinium-enhanced cardiovascular magnetic resonance: administered dose in relationship to United States Food and Drug Administration (FDA) guidelines. J Cardiovasc Magn Reson. 2012;14:18. 27. Nassenstein K, Waltering KU, Eggebrecht H, et al. MR coronary angiography with MS-325, a blood pool contrast agent: comparison of an inversion recovery steady-state free precession with an inversion recovery fast low angle shot sequence in volunteers. Rofo. 2006;178:50814. 28. Nassenstein K, Waltering KU, Kelle S, et al. Magnetic resonance coronary angiography with Vasovist: in-vivo T1 estimation to improve image quality of navigator and breath-hold techniques. Eur Radiol. 2008;18:1039. 29. Ritter CO, Wilke A, Wichmann T, et al. Comparison of intravascular and extracellular contrast media for absolute quantification of myocardial rest-perfusion using high-resolution MRI. J Magn Reson Imaging. 2011;33:104751. 30. Jerosch-Herold M, Hu X, Murthy NS, et al. Magnetic resonance imaging of myocardial contrast enhancement with MS-325 and its relation to myocardial blood flow and the perfusion reserve. J Magn Reson Imaging. 2003;18:54454. 31. Kawel N, Nacif M, Zavodni A, et al. T1 mapping of the myocardium: intra-individual assessment of the effect of field strength, cardiac cycle and variation by myocardial region. J Cardiovasc Magn Reson. 2012;14:27. 32. Kawel N, Nacif M, Zavodni A, et al. T1 mapping of the myocardium: intra-individual assessment of post-contrast T1 time evolution and extracellular volume fraction at 3T for Gd-DTPA and Gd-BOPTA. J Cardiovasc Magn Reson. 2012;14:26. 33. Aime S, Caravan P. Biodistribution of gadolinium-based contrast agents, including gadolinium deposition. J Magn Reson Imaging. 2009;30:125967. 34. Spinazzi A, Lorusso V, Pirovano G, et al. Safety, tolerance, biodistribution, and MR imaging enhancement of the liver with gadobenate dimeglumine: results of clinical pharmacologic and pilot imaging studies in nonpatient and patient volunteers. Acad Radiol. 1999;6:28291. 35. Balci NC, Inan N, Anik Y, et al. Low-dose gadobenate dimeglumine versus standard-dose gadopentate dimeglumine for delayed contrast- enhanced cardiac magnetic resonance imaging. Acad Radiol. 2006;13:8339. 36. Kuwatsuru R, Kadoya M, Ohtomo K, et al. Comparison of gadobenate dimeglumine with gadopentetate dimeglumine for magnetic resonance imaging of liver tumors. Invest Radiol. 2001;36:63241. 37. Schneider G, Maas R, Schultze Kool L, et al. Low-dose gadobenate dimeglumine versus standard dose gadopentetate dimeglumine for contrast-enhanced magnetic resonance imaging of the liver: an intra-individual crossover comparison. Invest Radiol. 2003;38:8594. 38. Darrah TH, Prutsman-Pfeiffer JJ, Poreda RJ, et al. Incorporation of excess gadolinium into human bone from medical contrast agents. Metallomics. 2009;1:47988. 39. Drape JL, Thelen P, Gay-Depassier P, et al. Intraarticular diffusion of Gd-DOTA after intravenous injection in the knee: MR imaging evaluation. Radiology. 1993;188:22734. 40. White GW, Gibby WA, Tweedle MF. Comparison of Gd(DTPABMA) (Omniscan) versus Gd(HP-DO3A) (ProHance) relative to gadolinium retention in human bone tissue by inductively coupled plasma mass spectroscopy. Invest Radiol. 2006;41:2728. 41. Jerosch-Herold M, Sheridan DC, Kushner JD, et al. Cardiac magnetic resonance imaging of myocardial contrast uptake and blood flow in patients affected with idiopathic or familial dilated cardiomyopathy. Am J Physiol Heart Circ Physiol. 2008;295:H1234H1242. 42. Sharma P, Socolow J, Patel S, et al. Effect of Gd-DTPA-BMA on blood and myocardial T1 at 1.5T and 3T in humans. J Magn Reson Imaging. 2006;23:32330. 1. MD, PhD, Universidade Federal Fluminense (UFF), Niterói, RJ, Brazil, National Institutes of Health Clinical Center, National Institute of Biomedical Imaging and Bioengineering, Bethesda, MD, USA 2. Biomedical Engineer, National Institutes of Health Clinical Center, National Institute of Biomedical Imaging and Bioengineering, Bethesda, MD, USA 3. MD, National Institutes of Health Clinical Center, National Institute of Biomedical Imaging and Bioengineering, Bethesda, MD, USA 4. PhD, National Institutes of Health Clinical Center, Bethesda, MD, USA 5. PhD, Leids Universitair Medisch Centrum, Zuid-Holland, the Netherlands 6. MD, PhD, National Institutes of Health Clinical Center, National Institute of Biomedical Imaging and Bioengineering, Bethesda, MD, USA Mailing address: Dr. Marcelo Souto Nacif Avenida São João, 2400, ap. 232B, Jardim das Colinas São José dos Campos, SP, Brazil, 12242-000 E-mail: msnacif@gmail.com Study conducted at the National Institutes of Health Clinical Center, Radiology and Imaging Sciences, Bethesda, MD, USA. Received April 19, 2016. Accepted after revision December 14, 2016. |
|
Av. Paulista, 37 - 7° andar - Conj. 71 - CEP 01311-902 - São Paulo - SP - Brazil - Phone: (11) 3372-4544 - Fax: (11) 3372-4554