Radiologia Brasileira - Publicação Científica Oficial do Colégio Brasileiro de Radiologia
AMB - Associação Médica Brasileira CNA - Comissão Nacional de Acreditação
 Vol. 50 nº 1 - Jan. /Feb. of 2017
|
ICONOGRAPHIC ESSAY
|
|
Imaging of tuberous sclerosis complex: a pictorial review |
|
|
Autho(rs): Felipe Mussi von Ranke1; Igor Murad Faria1; Gláucia Zanetti2; Bruno Hochhegger3; Arthur Soares Souza Jr.4; Edson Marchiori2 |
|
|
Keywords: Tuberous sclerosis; Computed tomography; Magnetic resonance imaging. |
|
|
Abstract: INTRODUCTION
Tuberous sclerosis complex (TSC) is a genetically determined multisystem hamartomatous neurocutaneous disease. The organs most commonly involved are the brain, skin, kidney, lung, retina, and heart(1). The wide range of organs affected by the disease implies that TSC1 and TSC2 genes play important roles in the regulation of cell proliferation and differentiation(2). The classic triad of manifestations consists of facial adenoma sebaceum, epilepsy, and mental retardation(3). The presence of common manifestations, including cortical tubers or subependymal nodules, white matter (WM) abnormalities, retinal abnormalities, cardiac rhabdomyoma, lymphangioleiomyomatosis (LAM), and renal angiomyolipoma (AML), allows confirmation of the diagnosis, especially when associated with skin lesions(4). Imaging is important in the evaluation of TSC because of its roles not only in presumptive diagnosis, but in defining the full extent of involvement. Imaging also contributes to treatment planning. DIAGNOSIS The demonstration of a pathogenic mutation in the TSC1 or TSC2 gene in normal tissue is now considered sufficient for the diagnosis of TSC, independent of clinical manifestations(5). Clinical diagnostic criteria are important, however, because genetic testing may not identify a mutation in up to 25% of patients. The clinical criteria are divided into major and minor features, with definitive diagnosis defined by the presence of at least two major features or one major and two minor features. The diagnosis of TSC is considered possible in the presence of one major or two or more minor features(5). INTRACRANIAL MANIFESTATIONS Cortical tubers The expansive lesions of the central nervous system alone are not diagnostic of TSC and may be seen in other pathological conditions(610). Cortical tubers are benign hamartomas detectable in the cerebral cortex in approximately 95% of patients with TSC(4). They are considered to be related closely to the neurological manifestations of TSC, including epilepsy, cognitive disability, and neurobehavioural abnormalities(4). On magnetic resonance imaging (MRI), cortical tubers typically appear as well-circumscribed areas of low signal intensity on T1-weighted and high signal intensity on T2-weighted sequences(11) (Figures 1 and 2). 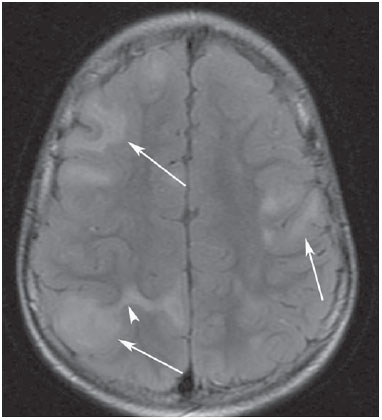 Figure 1. An 8-year-old boy with tuberous sclerosis complex. Axial fluid-attenuation inversion-recovery image demonstrates cortical tubers (arrows) as well-circumscribed areas of high signal intensity. Superficial white matter abnormalities are seen as hyperintense areas in relation to tubers (arrowhead). 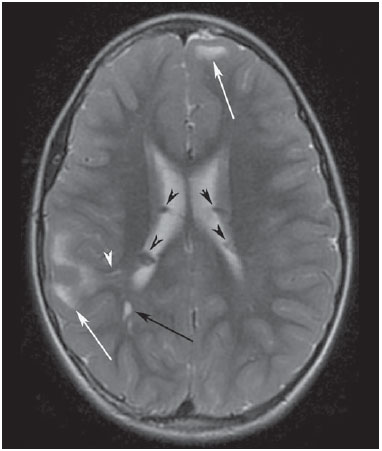 Figure 2. A 12-year-old boy with tuberous sclerosis complex. Axial T2-weighted image shows cortical tubers as well-circumscribed areas of high signal intensity (white arrows) and subependymal nodules along the ventricular surface (black arrowheads). Note radial migration line appearing as a thin, straight band of hyperintensity extending from the juxtaventricular white matter to the cortex (black arrow), and white matter cyst-like lesion located in deep white matter near the atrium of the right lateral ventricle (white arrowhead). Subependymal nodules Subependymal nodules are common brain lesions found in patients with TSC, which represent hamartomatous growths. Typically benign, subependymal nodules can degenerate into subependymal giant cell astrocytomas (SEGAs)(11). Computed tomography (CT) is useful for the detection of subependymal nodules, as they are associated with calcification far more commonly (88%) than are cortical tubers(4). On MRI, subependymal nodules show intermediate signal intensity on T1-weighted images and isointense to hyperintense signals on T2-weighted images(3,4) (Figure 2). Subependymal giant cell astrocytomas SEGAs are widely accepted to be derived from subependymal nodules(2). The prognosis is generally good, as SEGAs grow slowly. However, SEGA growth may result in ventricular obstruction and hydrocephalus(4). SEGAs are hypo- to isointense compared with cortex on T1-weighted images and heterogeneously iso- to hyperintense on T2-weighted images(3) (Figure 3). 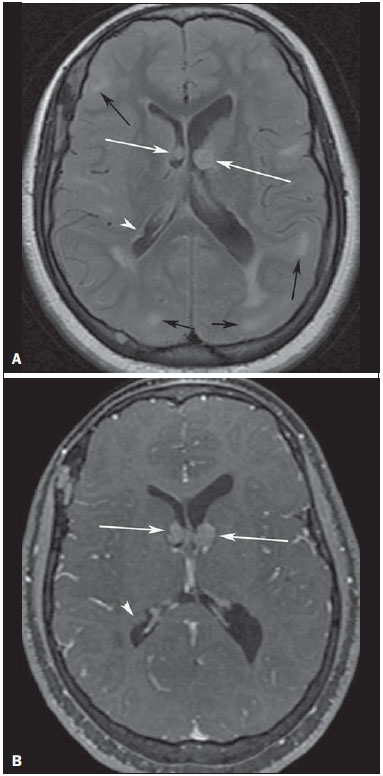 Figure 3. A 23-year-old woman with tuberous sclerosis complex and subependymal giant cell astrocytomas. Axial fluid-attenuation inversion-recovery image (A) shows heterogeneous hyperintense masses (subependymal giant cell astrocytomas) located at the frontal horn of the lateral ventricles, near the foramen of Monro (white arrows). Axial contrast-enhanced T1-weighted image (B) shows strong and heterogeneous enhancement of the lesions (white arrows). Note also cortical tubers (black arrows), and subependymal nodule along the right lateral ventricular surface (arrowheads), best depicted on fluid-attenuation inversion-recovery image. White matter abnormalities WM abnormalities in TSC include superficial abnormalities associated with cortical tubers, radial migration lines (RMLs), and cyst-like WM lesions. On MRI, superficial WM abnormalities are seen as hyperintense areas on T2-weighted images and hypointense areas on T1-weighted images (Figure 1). RMLs appear as thin, straight or curvilinear bands of hyperintensity on T2-weighted images and show iso- to hypointensity on T1-weighted sequences. Cyst-like WM lesions are small well-demarcated lesions with intensity similar to that of cerebrospinal fluid. They are seen in deep WM, typically near the lateral ventricles(4,11). PULMONARY MANIFESTATIONS Lymphangioleiomyomatosis LAM is a rare disorder that often occurs in patients with TSC (TSC-LAM). A rare sporadic form (S-LAM) affects the lungs, lymphatics, retroperitoneum, and kidneys(4,12). TSC-LAM and S-LAM affect women almost exclusively and are characterized by diffuse interstitial proliferation of smooth muscle cell bundles and cystic changes in the pulmonary parenchyma. The hallmark feature of LAM is the presence of diffuse, well-circumscribed, thin-walled lung cysts distributed uniformly throughout the lungs(4,12) (Figure 4). Clinically, LAM is characterized by progressive dyspnoea on exertion, recurrent pneumothoraces (Figure 5), and abdominal tumors, including AMLs and lymphangiomyomas(4,12). Pneumothorax and chylous pleural effusion are the two major complications of pulmonary LAM(4). 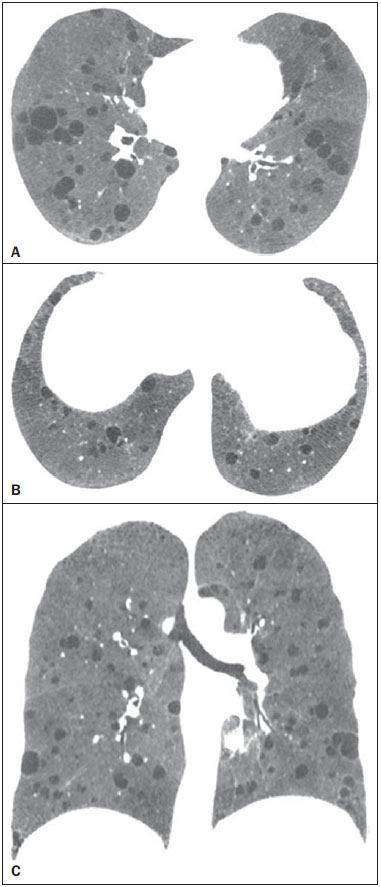 Figure 4. A 52-year-old woman with tuberous sclerosis complex. Axial (A,B) and coronal (C) CT minimaximum-intensity projection images show numerous bilateral, variably sized thin-walled cysts, compatible with lymphangioleiomyomatosis. 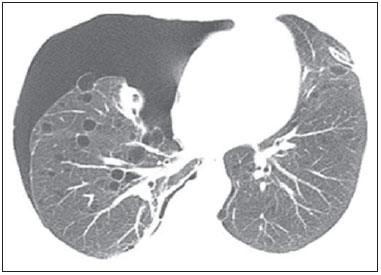 Figure 5. A 52-year-old woman with tuberous sclerosis complex presenting with sudden onset of right chest pain and dyspnoea. Axial CT image obtained with the lung window setting shows right-sided pneumothorax and numerous thin-walled cysts scattered throughout the lungs, compatible with lymphangioleiomyomatosis. Multifocal micronodular pneumocyte hyperplasia Multifocal micronodular pneumocyte hyperplasia is the second lung manifestation in TSC. It is a rare pulmonary disorder characterized by multicentric, well-demarcated nodular proliferation of type II pneumocytes along alveolar septa(5). Multifocal micronodular pneumocyte hyperplasia is characterized on high-resolution CT by multiple non-calcified pulmonary nodules or nodular ground-glass opacities ranging in size from 2 mm to 1 cm, scattered diffusely and randomly throughout the lung(12). CARDIAC MANIFESTATIONS Cardiac rhabdomyoma is a benign striated muscle tumor and the most common cardiac tumor in children(4,5,13). It occurs in about 60% of children, but only 20% of adults, with TSC(4,5,13,14). Most rhabdomyomas are asymptomatic, with a minority of patients experiencing arrhythmia and/or cardiac failure(1,5). Echocardiography has been established as the primary diagnostic tool for the evaluation of cardiac rhabdomyomas in children(3,4). CT or MRI can provide additional information regarding tumour extension or size, especially in older patients or those from whom echocardiographic images are poor due to bone or lung interference(4). RENAL MANIFESTATIONS Renal angiomyolipoma AMLs are the most common mesenchymal renal neoplasms. They occur as isolated, sporadic entities in 80% of cases, most commonly manifesting in middle-aged women(10). The other 20% of AMLs develop in association with TSC. AMLs are found in7080% of patients with TSC(4,5,1315). The most alarming complication of renal AMLs is rupture, due to their abnormal vasculature, associated frequently with aneurysms(2,13,14) (Figure 6). CT permits the diagnosis of renal AML by demonstrating the presence of intratumoral fat (Figure 7). Attenuation < 20 HU is a characteristic finding of AML in unenhanced CT examination(4,15). AMLs with a predominant fatty component are isointense relative to fat on all MRI sequences(3); their signal intensity is typically higher than that of the renal parenchyma on T1-weighted images, and homogeneous and high on T2-weighted images(3,4) (Figure 8). 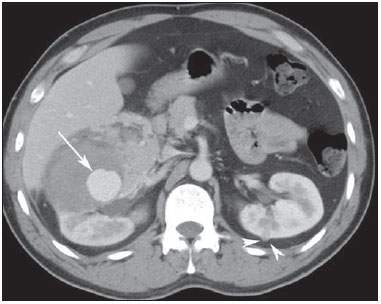 Figure 6. A 38-year-old man with tuberous sclerosis complex and renal lipid-poor angiomyolipoma. Axial contrast-enhanced CT image shows a large, high-attenuation, enhancing heterogeneous tumour with an aneurysm in the right kidney (arrow). This patient also had a small lipid-poor angiomyolipoma in the left kidney (arrowhead). 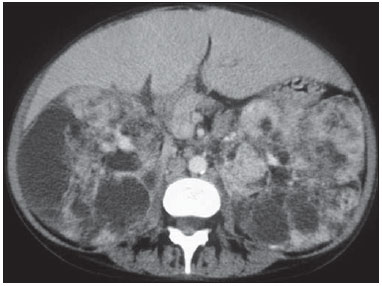 Figure 7. A 31-year-old woman with tuberous sclerosis complex and renal angiomyolipomas. Axial unenhanced CT image demonstrates multiple fat-containing tumors in the kidneys. 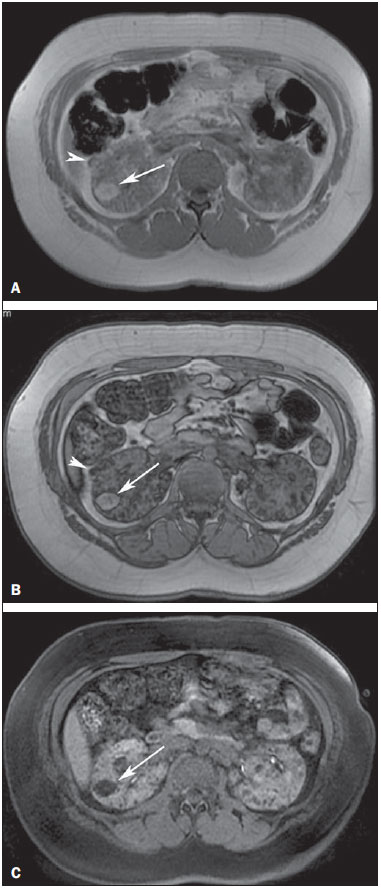 Figure 8. A 21-year-old woman with tuberous sclerosis complex and multiple renal angiomyolipomas. T1-weighted in-phase gradient-recalled echo image (A) shows a hyperintense right renal mass (arrow). T1-weighted opposed-phase gradient-recalled echo image (B) shows a peripheral India ink artefact at the fatwater interface between the mass and surrounding normal renal parenchyma, a finding diagnostic of lipid-rich angiomyolipoma. T1-weighted fat-suppressed image (C) shows diffuse intralesional low signal intensity in the lipid-rich angiomyolipoma. Note also a lipid-poor angiomyolipoma in the right kidney, appearing as a hyperintense nodular lesion in (A) (arrowhead) and presenting homogeneous internal signal loss in (B) (arrowhead) due to the presence of microscopic amounts of fat within the lesion. Renal cell carcinoma Renal cell carcinoma (RCC) is a rare manifestation in patients with TSC, with an estimated incidence of 24%, which is nonetheless higher than in the general population(1,13,15,16). Imaging findings depend on RCC subtype. Clear cell RCC, the most common subtype, shows hypo- to isointensity on T1-weighted images and iso- to hyperintensity on T2-weighted images(24). Papillary RCC commonly demonstrates low signal intensity on T2-weighted images and tends to exhibit hypovascular and homogeneous enhancement, which can be difficult to differentiate from that of lipid-poor AMLs(4,15). OTHER MANIFESTATIONS Detection of characteristic dermatological lesions, which can appear anytime during childhood, is important in the diagnosis of TSC. The most common lesions are hypomelanotic macules, angiofibromas, shagreen patches (Figure 9), forehead plaques, and ungual fibromas(2,5). 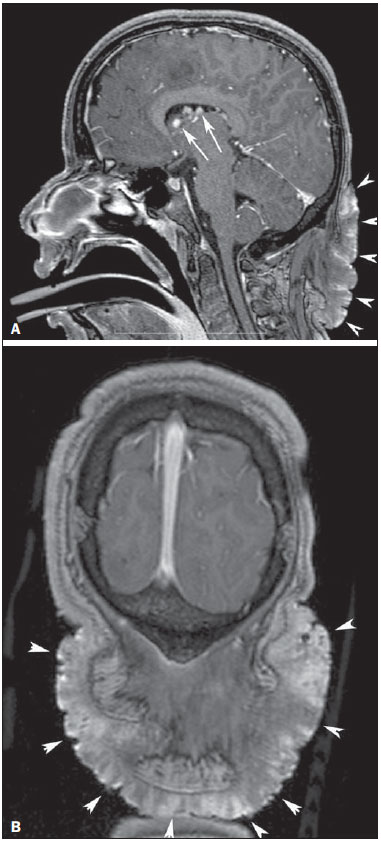 Figure 9. A 13-year-old boy with tuberous sclerosis complex. Sagittal (A) and coronal (B) T1-weighted images with gadolinium enhancement show a large, protuberant, irregularly thickened, elevated skin patch with an irregular border in the dorsal cervical region, consistent with shagreen patch (arrowheads). Note also in (A) enhancing subependymal nodules (arrows) projecting into the lumen of the lateral ventricle in the region of the foramen of Monro. The involvement of various abdominal organs, including the alimentary tract, hepatobiliary system, and pancreas, has been reported in patients with TSC. Hepatobiliary lesions, including hepatomegaly, AMLs, lipomas, hamartomas, and fibromas, have been described in patients with TSC. Most hepatic AMLs are sporadic(4). The incidence of hepatic AML (Figure 10) is much lower than that of renal AML in patients with TSC(5). Skeletal abnormalities in TSC include cyst-like lesions, hyperostosis of the inner table of the calvaria, osteosclerotic changes (Figure 11), periosteal new bone formation, cystic changes in the phalanges, and scoliosis(3). These bone abnormalities can also be seen in several other diaseases(1722), and only in the presence of changes in other organs that fulfill TSC criteria can be associated with the complex. Retinal hamartomas are present in about 4050% of patients with TSC. When retinal hamartomas have calcification, ultrasound, CT, and MRI can show these lesions(2). 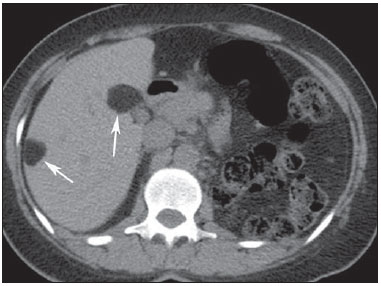 Figure 10. A 27-year-old man with tuberous sclerosis complex. Axial unenhanced CT image shows two well-defined nodular lesions with fat attenuation (arrows) in the liver, compatible with angiomyolipomas. 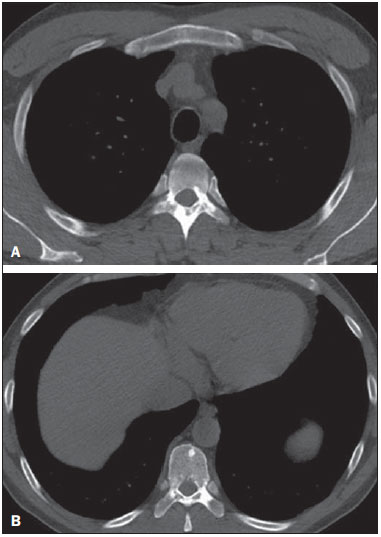 Figure 11. A 22-year-old woman with tuberous sclerosis complex and sclerotic spinal bone lesions. Axial CT images at the T5 (A) and T8 (B) levels demonstrate round, oval, and elongated sclerotic bone lesions on the anterior aspects of the vertebral bodies, pedicles, laminas, and transverse and spinous processes. REFERENCES 1. Curatolo P, Bombardieri R, Jozwiak S. Tuberous sclerosis. Lancet. 2008;372:65768. 2. Crino PB, Nathanson KL, Henske EP. The tuberous sclerosis complex. N Engl J Med. 2006;355:134556. 3. Evans JC, Curtis J. The radiological appearances of tuberous sclerosis. Br J Radiol. 2000;73:918. 4. Umeoka S, Koyama T, Miki Y, et al. Pictorial review of tuberous sclerosis in various organs. Radiographics. 2008;28:e32. 5. Northrup H, Krueger DA; International Tuberous Sclerosis Complex Consensus Group. Tuberous sclerosis complex diagnostic criteria update: recommendations of the 2012 International Tuberous Sclerosis Complex Consensus Conference. Pediatr Neurol. 2013;49:24354. 6. Destefani MH, Mello AS, Oliveira RS, et al. Chordoid glioma of the third ventricle. Radiol Bras. 2015;48:3389. 7. Machado VS, Silva Junior NA, Queiroz LS, et al. Central nervous system involvement in sarcoidosis. Radiol Bras. 2015;48:3345. 8. Schwingel R, Duarte SBL, Oshima MM, et al. Multiple hemangioblastomas, association with von Hippel-Lindau syndrome. Radiol Bras. 2015:48(2):xixiii. 9. Dultra AHA, Noro F, Melo ASA, et al. Primary intercavernous lymphoma of the central nervous system. Radiol Bras. 2015;48:3378. 10. Sharma R, Gupta P, Mahajan M, et al. Giant nontraumatic intradiploic arachnoid cyst in a young male. Radiol Bras. 2016;49:3379. 11. Kalantari BN, Salamon N. Neuroimaging of tuberous sclerosis: spectrum of pathologic findings and frontiers in imaging. AJR Am J Roentgenol. 2008;190:W3049. 12. Franz DN, Brody A, Meyer C, et al. Mutational and radiographic analysis of pulmonary disease consistent with lymphangioleiomyomatosis and micronodular pneumocyte hyperplasia in women with tuberous sclerosis. Am J Respir Crit Care Med. 2001;164:6618. 13. De Waele L, Lagae L, Mekahli D. Tuberous sclerosis complex: the past and the future. Pediatr Nephrol. 2015;30:177180. 14. Leung AK, Robson WL. Tuberous sclerosis complex: a review. J Pediatr Health Care. 2007;21:10814. 15. Manoukian SB, Kowal DJ. Comprehensive imaging manifestations of tuberous sclerosis. AJR Am J Roentgenol. 2015;204:93343. 16. Muglia VF, Prando A. Renal cell carcinoma: histological classification and correlation with imaging findings. Radiol Bras. 2015;48: 16674. 17. Braun RA, Milito CFRB, Goldman SM, et al. Ivory vertebra: imaging findings in different diagnoses. Radiol Bras. 2016;49:11721. 18. Andrade Neto F, Teixeira MJD, Araújo LHC, et al. Knee bone tumors: findings on conventional radiology. Radiol Bras. 2016;49:1829. 19. Lima Júnior FVA, Savarese LG, Monsignore LM, et al. Computed tomography findings of paracoccidiodomycosis in musculoskeletal system. Radiol Bras. 2015;48:16. 20. Petrilli M, Senerchia AA, Petrilli AS, et al. Computed tomographyguided percutaneous trephine removal of the nidus in osteoid osteoma patients: experience of a single center in Brazil. Radiol Bras. 2015;48:2115. 21. Franca PMV, Ferrreira CS, Figueiredo R, et al. Melorheostosis. Radiol Bras. 2015;48:601. 22. Guimarães JB, Rigo L, Lewin F, et al. The importance of PET/CT in the evaluation of patients with Ewing tumors. Radiol Bras. 2015;48:17580. 1. MD, Universidade Federal do Rio de Janeiro (UFRJ), Rio de Janeiro, RJ, Brazil 2. MD, PhD, Universidade Federal do Rio de Janeiro (UFRJ), Rio de Janeiro, RJ, Brazil 3. MD, PhD, Santa Casa de Porto Alegre, Porto Alegre, RS, Brazil 4. MD, PhD, Faculdade de Medicina de São José do Rio Preto (Famerp) and Ultra X, São José do Rio Preto, SP, Brazil Mailing address: Dr. Edson Marchiori Rua Thomaz Cameron, 438, Valparaíso Petrópolis, RJ, Brazil, 25685-120 E-mail: edmarchiori@gmail.com Received January 5, 2016. Accepted after revision February 14, 2016. Study conducted at the Universidade Federal do Rio de Janeiro (UFRJ), Rio de Janeiro, RJ, Brazil. |
|
Av. Paulista, 37 - 7° andar - Conj. 71 - CEP 01311-902 - São Paulo - SP - Brazil - Phone: (11) 3372-4544 - Fax: (11) 3372-4554