Radiologia Brasileira - Publicação Científica Oficial do Colégio Brasileiro de Radiologia
AMB - Associação Médica Brasileira CNA - Comissão Nacional de Acreditação
 Vol. 49 nº 3 - May / June of 2016
|
ORIGINAL ARTICLES
|
|
Influence of partial k-space filling on the quality of magnetic resonance images |
|
|
Autho(rs): Tiago da Silva Jornada1; Camila Hitomi Murata2; Regina Bitelli Medeiros3 |
|
|
Keywords: Magnetic resonance imaging; K-space; Quality control; In vivo magnetic resonance imaging. |
|
|
Abstract: INTRODUCTION
One way of reducing image acquisition time is to reduce the number of lines to be filled in the k-space. However, adopting this measure can have a negative effect on image quality(1). All of the information used in presenting magnetic resonance imaging (MRI) scans is first acquired in the k-space, which represents the spatial frequency domain(2,3). The k-space is not a physical location in the MRI equipment but an abstract concept that can be understood as a matrix containing a series of data related to the frequencies and phases of the signals collected(4). Whenever an echo-phase encoding plus frequency encoding-is obtained, the information is stored on a line in the k-space. A point in the k-space does not correspond to a point in the image. The peripheral lines contain information on the spatial resolution of the object, whereas the central lines represent the contrast, and the relationship between the k-space and the image can be obtained by the two-dimensional (2D) Fourier transform(1,2,4). Because k-space filling can be manipulated by the operator, understanding of the concept can redirect the clinical routine(2,5). Different techniques, such as fast spin-echo imaging, parallel image acquisition, keyhole imaging, single-shot imaging, echo-planar imaging, partial echo acquisition, and half-Fourier acquisition(6), organize the collected data in different ways in the k-space(7). In some models of their MRI equipment, the manufacturer Philips offers a tool called scan percentage (ScP). This resource manipulates k-space filling using a technique similar to the half-Fourier method. What differentiates the ScP tool is that when adopting a protocol with maximum ScP value (100%), all signals are transported and stored in the lines of the k-space without any kind of processing (raw data). However, by changing the ScP value in the acquisition protocol (i.e., adopting a percentage that is lower than the maximum value), some data are not transported, resulting in unfilled lines, specifically the upper and lower peripheral lines. In those regions, the intensity value of each pixel is approximately zero(8). With the half-Fourier method, the individual pixel intensity value is approximately zero only on the lower peripheral lines(6). Using the ScP tool without prior knowledge of its influence on image quality can compromise the analysis of certain diseases, such as cartilage disorders(5). The most frequent disease related to hyaline cartilage degeneration is osteoarthritis, for which radiologists have adopted the Kellgren-Lawrence (KL) grading scale used to evaluate the cartilage condition(9). The KL scale uses five grades to indicate the severity of the disease: grade 0 indicates normal cartilage; grade I indicates inconclusive evidence of joint space narrowing; grade II indicates possible cartilage narrowing; grade III indicates visible cartilage narrowing; and grade IV indicates marked cartilage narrowing(9-11). One of the ways of evaluating MRI is to use reference phantoms(12) and compare technical parameters, although there are not many studies that have associated such images with in vivo tests. It is generally recommended that, for quality control tests on MRI scanners, reference phantoms be used in accordance with guidelines established by international organizations. The specialized literature includes publications from the American Association of Physicists in Medicine(13), the National Electrical Manufacturers Association(14), the American College of Radiology(15), the study of Wood et al.(16) , and the Institute of Physics and Engineering in Medicine(17). The American College of Radiology has proposed an MRI Accreditation Program(15). There are no standard practices for quality control tests in Brazil. However, there is a program created by the Brazilian National Accreditation Organization(18) for the evaluation and certification of health services, and there is the Magnetic Resonance Imaging Quality Program created by the Brazilian College of Radiology and Diagnostic Imaging(19). In addition, the study conducted by Mazzola et al.(20) has been adopted as a reference in the field. The purpose of this study was to evaluate the influence of the ScP tool on image quality, by comparing phantom and in vivo images. MATERIALS AND METHODS Phantom The MRI equipment used was the ACS-NT Gyroscan 1.5 T scanner (Philips Medical Systems; Best, the Netherlands) with a 15 mT gradient, and a Magphan® phantom (The Phantom Laboratory, Greenwich, NY, USA) filled with demineralized water, and the signal was captured with a quadrature head coil. The technical parameters of the protocols adopted in the imaging process with the phantom were as follows: for axial T1-weighted images-field of view (FOV): 230 mm; reduced field of view (RFOV): 100%; repetition time/echo time (TR/ TE): 638/14 ms; flip angle: 90º; number of excitations (NEX): 2; reconstruction matrix: 512 × 512; acquisition matrix: 256 × 256; interslice gap: 1 mm; slice thickness: 4 mm; spacing: 4.4 mm-and for axial T2-weighted images- FOV: 230 mm; RFOV: 100%; TR/TE: 4986/100 ms; flip angle: 90º; NEX: 2; reconstruction matrix: 512 × 512; acquisition matrix: 256 × 256; interslice gap: 1 mm; slice thickness: 4 mm; spacing: 4.4 mm. For each protocol, four ScP variations were studied: 50%, 70%, 85%, and 100%. The influence that signal intensity variations in the k-space had on image quality was analyzed from phantom images according to three quality criteria-1) uniformity; 2) signal-to-noise ratio (SNR); 3) high-contrast spatial resolution-following the recommendations of the American Association of Physicists in Medicine(13) and the manufacturer's instructions(21). 1. Uniformity - Quantifies the performance of the equipment in representing a homogenous region in the image, with a minimum of variation in intensity. Uniformity can be given by the following equation: 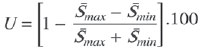 where  max is the pixel intensity value with the strongest signal and min is the pixel intensity value with the lowest signal. max is the pixel intensity value with the strongest signal and min is the pixel intensity value with the lowest signal.2. SNR - Quantifies the signal fluctuation at a given region of interest. The SNR can be obtained by the following equation:  where is the mean signal in a given region of interest and s is the standard deviation resulting from the subtraction of two images.3. High-contrast spatial resolution - Shows the capacity of the equipment to distinguish the spacing between objects, without superimposing the structures. It is obtained by a qualitative analysis of the phantom's internal structures on high-resolution images. Internally, the objects represent 1, 2, 3, 4, 5, 6, 7, 8, 9, 10, and 11 pairs of lines/cm (Figure 1). 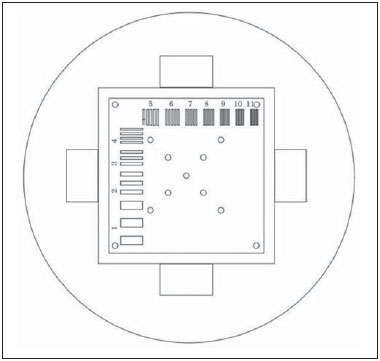 Figure 1. Region of the phantom where the high-contrast spatial resolution analysis is made. In vivo For the in vivo tests, which were approved by the Research Ethics Committee of the Escola Paulista de Medicina - Universidade Federal de São Paulo, the same MRI equipment was used with an appropriate quadrature knee coil, with the following acquisition parameters: for sagittal T1-weighted images-FOV: 230 mm; RFOV: 100%; TR/TE: 535/12 ms; flip angle: 90º; NEX: 2; reconstruction matrix: 512 × 512; acquisition matrix: 256 × 256; interslice gap: 1 mm; slice thickness: 4 mm; spacing: 4.4 mm-and for sagittal T2-weighted images-FOV: 230 mm; RFOV: 100%; TR/TE: 2440/60 ms; flip angle: 90º; NEX: 2; reconstruction matrix: 512 × 512; acquisition matrix: 256 × 256; interslice gap: 1 mm; slice thickness: 4 mm; spacing: 4.4 mm. For each protocol, we studied seven ScP variations (25%, 40%, 50%, 60%, 70%, 85%, and 100%), and we used the RadiAnt DICOM Viewer software (Medixant, Poznan, Poland) to analyze the images(22), as shown in Figure 2. 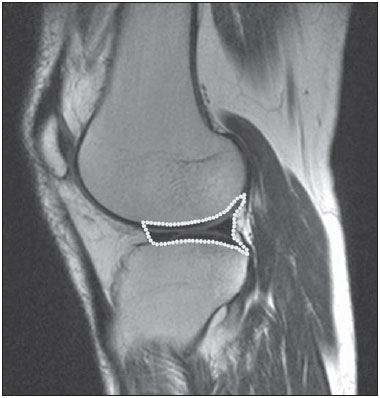 Figure 2. Magnetic resonance imaging scans of the in vivo object of study. The white outline indicates the region of analysis. Statistical analysis Initially, a normal distribution of the pixel intensity values in the region of the hyaline cartilage was observed (Figure 2) with the Kolmogorov-Smirnov Z test. After having verified the normality of the data, we performed analysis of variance with the Student-Newman-Keuls post hoc test. For non-normal data, we opted to use the Kruskal-Wallis test with the Müller-Dunn post hoc test. The statistical analysis software used were the SPSS Statistics software package (IBM Corp., Armonk, NY, USA) and BioEstat, version 5.3 (Instituto Mamirauá, Tefé, Brazil). RESULTS When analyzing the phantom images, with help of software MatLab® (MathWorks; Natick, Mass., USA), we applied the inverse 2D Fourier transform in the images obtained with each ScP variation, resulting in the k-space of the respective image, as shown in Figure 3. 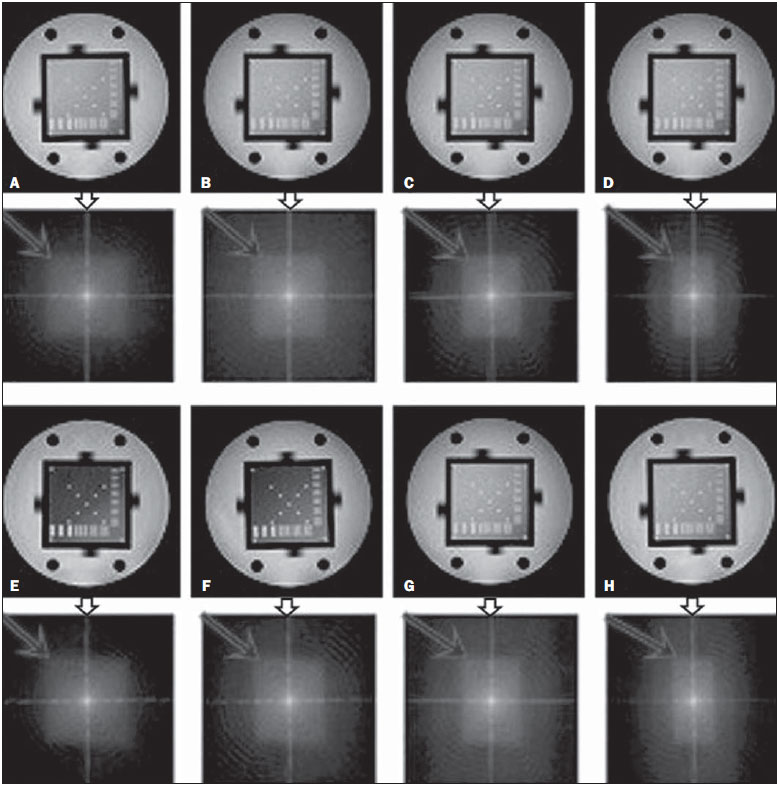 Figure 3. Phantom images with the following ScP variations: 100% (A), 85% (B), 70% (C) and 50% (D), T1-weighted; 100% (E), 85% (F), 70% (G), and 50% (H), T2-weighted. The white arrows indicate the k-space of the respective images. The influence of signal intensity variation in the k-space, in relation to uniformity, SNR, and high-contrast spatial resolution analysis, is shown in Table 1. 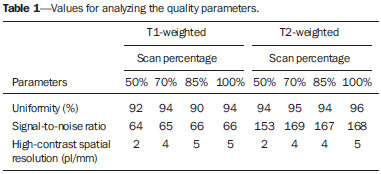 Adopting seven percentages of k-space filling (25%, 40%, 50%, 60%, 70%, 85%, and 100%), we obtained in vivo anatomical images (Figures 4 and 5). 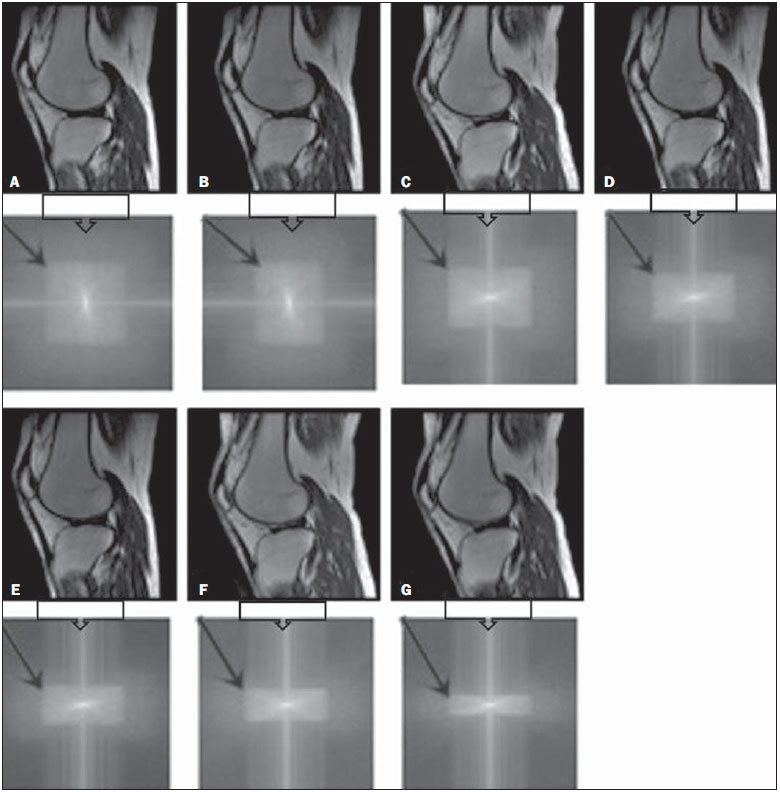 Figure 4. T1-weighted magnetic resonance imaging scans with the following ScP variations: 100% (A), 80% (B), 70% (C), 60% (D), 50% (E), 40% (F), and 25% (G). The black arrows indicate the k-space of the respective images. 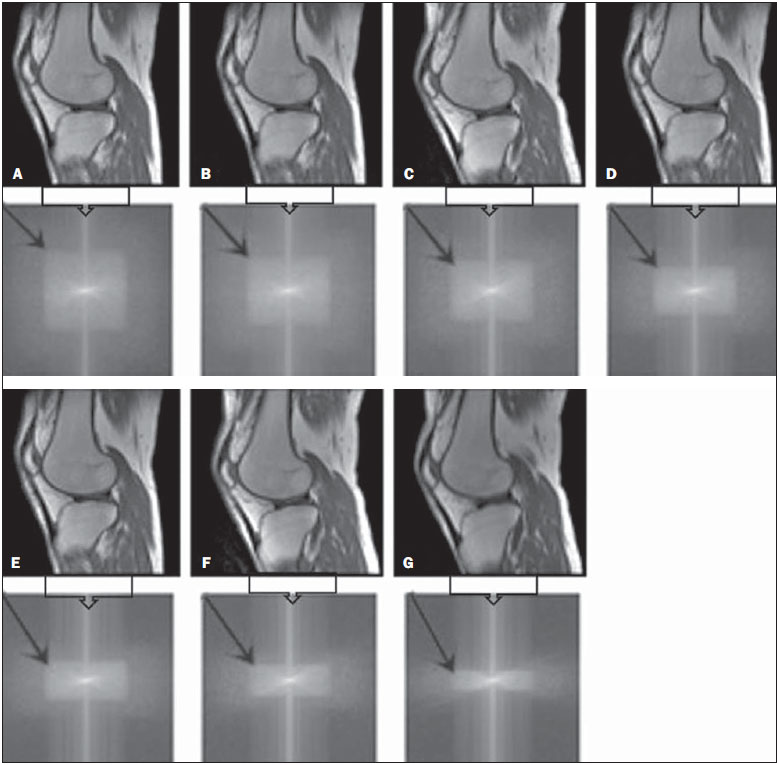 Figure 5. T2-weighted magnetic resonance images with the following ScP variations: 100% (A), 80% (B), 70% (C), 60% (D), 50% (E), 40% (F), and 25% (G). The black arrows indicate the k-space of the respective images. The Kolmogorov-Smirnov Z test of normality showed p < 0.0001 in all regions studied, regardless of the ScP variation chosen, proving that the pixel intensity values represents a parametric (normal) distribution. Therefore, the difference in pixel value intensity between the different ScP variations was determined with analysis of variance and the Student-Newman-Keuls post hoc test, both at a 5% level of significance. Table 2 shows the results of the statistical analysis of T1-weighted images, and Table 3 shows the results of the statistical analysis of T2-weighted images. 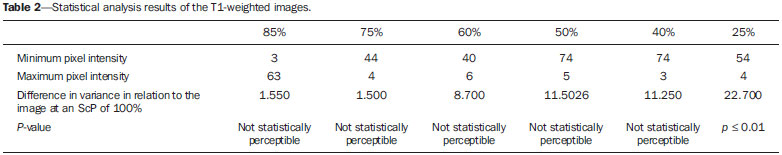 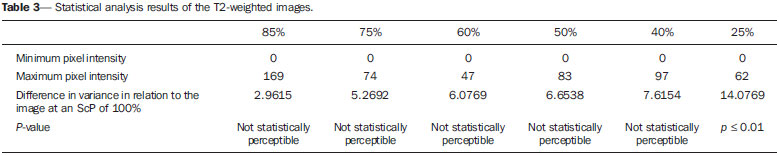 DISCUSSION Through visual analysis of each k-space image, it is possible to identify a central area with greater signal intensity. As the k-space filling percentage is reduced, a gradual loss in intensity is observed, regardless of the weighting adopted. With an ScP variation of 50%, the signal loss is more pronounced, because half of the k-space is omitted. The values associated with uniformity in the image do not show significant variation with the ScP values adopted, remaining within the > 90% acceptance limit(15,23). For the evaluation of SNR, a comparison with the reference values provided by the manufacturer, using serial measurements, is recommended. Because those data are unavailable, we stipulated an acceptance margin of ± 10% in SNR variation in relation to the acquired value with 100% ScP . For T1-weighted images, the SNR varied by approximately 1%. For T2-weighted images, the greatest SNR variation was 9.8% (when an ScP variation of 50% was adopted). Therefore, the SNR is in conformity with the variation adopted. Because this filling method leaves the central k-space lines unaltered, it was possible to the keep the uniformity and SNR values in conformity with the criteria adopted. In the spatial resolution analysis, there was a loss in image quality when ScP variations of 70% and 85% in T1- and T2-weighted images, respectively. The recommended spatial resolution is > 1 mm (5 pl/mm) with well-defined borders between the phantom test structures(15,23), a criterion that was not met with ScP variations of 70% and 85% in T1- and T2-weighted images, respectively. An omission of 25% of the peripheral lines in the k-space proved to be sufficient to cause significant degradation of the high-contrast spatial resolution. The cartilage studied was classified as grade 0 at all ScP variations. There were no changes in the KL scale cartilage grade in T1- or T2-weighted images. However, the visual analysis of all k-spaces (Figures 4 and 5) showed a reduction in the signal intensity, resulting in a loss of contrast and structure resolution. According to Albuquerque et al.(11), the analysis of cartilage degradation and its KL scale grading are subjective and can be influenced by the level of experience of the radiologist. The loss of contrast and spatial resolution detected in the images can lead to misdiagnoses by inexperienced professionals. On the T1- and T2-weighted images, the results were p < 0.01, with evidence to reject the null hypothesis. However, there was at least one group with nonhomogeneous population variations. Therefore, partial k-space filling showed a statistically significant variation in the pixel intensity values in at least one of the adopted situations in relation to an ScP value of 100%. With the Student Newman-Keuls post hoc test, it was proven that the variation in k-space filling at an ScP variation of 25% showed a statistically significant difference in relation to that observed at an ScP variation of 100% in the T1- and T2-weighted images. CONCLUSION The phantom images showed variations in high-contrast spatial resolution that were not perceptible in the in vivo images, because the phantom contains known standards that allow a more careful analysis. The analysis involving the phantom showed that it is possible to use ScP variations of 70% and 85% in the acquisition of T1- and T2-weighted clinical images, respectively, without significant quality loss. Adopting values below those acquisition levels would require analysis by a multidisciplinary team and involving a significant sample of patients. The use of tools that limit the k-space is not recommended without knowledge of their effect on image quality. Acknowledgments This study received financial support from the Coordenação de Aperfeiçoamento de Pessoal de Nível Superior (Capes), in the form of doctoral and master's scholarships. The authors are grateful to the radiology technicians in the Department of Diagnostic Imaging, for their assistance in obtaining the images and for providing specific information for this project, as well as to the Physics and Radiation Hygiene team of the Escola Paulista de Medicina Universidade Federal de São Paulo. REFERENCES 1. Bronzino JD. The biomedical engineering handbook. 2nd ed. Boca Raton, FL: CRC Press LLC; 2000. 2. Mezrich R. A perspective on k-space. Radiology. 1995;195:297-315. 3. Dhawan AP. Medical image analysis. 2nd ed. Hoboken, NJ: Wiley-IEEE Press; 2011. 4. Mazzola A. Ressonância magnética: princípios de formação da imagem e aplicações em imagem funcional. Rev Bras Fís Méd. 2009;3:117-29. 5. Paschal CB, Morris HD. K-space in the clinic. J Magn Reson Imaging. 2004;19:145-59. 6. Liney G. MRI from A to Z: a definitive guide for medical professionals. 2nd ed. London, UK: Springer-Verlag; 2011. 7. Westbrook C, Roth CK, Talbot J. Ressonância magnética: aplicações práticas. 4ª ed. Rio de Janeiro, RJ: Guanabara Koogan; 2013. 8. Bloemers K, Sjef G. Strategies for faster scanning in orthopedics. Philips NetForum Community; 2005. [cited 2015 June 6]. Available from: http://clinical.netforum.healthcare.philips.com/global/Operate/Application-Tips/MRI/Strategies-for-faster-scanning-inorthopedics 9. Peterfy CG, Guermazi A, Zaim S, et al. Whole-Organ Magnetic Resonance Imaging Score (WORMS) of the knee in osteoarthritis. Osteoarthritis Cartilage. 2004;12:177-90. 10. Roemer FW, Guermazi A, Hunter DJ, et al. The association of meniscal damage with joint effusion in persons without radiographic osteoarthritis: the Framingham and MOST osteoarthritis studies. Osteoarthritis Cartilage. 2009;17:748-53. 11. Albuquerque RP, Giordano V, Sturm L, et al. Análise da reprodutibilidade de três classificações para a osteoartrose do joelho. Rev Bras Ortop. 2008;43:329-35. 12. Chen CC, Wan YL, Wai YY, et al. Quality assurance of clinical MRI scanners using ACR MRI phantom: preliminary results. J Digit Imaging. 2004;17:279-84. 13. AAPM - American Association of Physicists in Medicine. AAPM Report No.100. Acceptance testing and quality assurance procedures for magnetic resonance imaging facilities. [cited 2015 June 6]. Available from: http://www.aapm.org/pubs/reports/RPT_100.pdf 14. NEMA - National Electrical Manufacturers Association. MS1-94. Determination of signal to noise ratio (SNR) in diagnostic magnetic resonance imaging. Rosslyn, VA: National Electrical Manufacturers Association; 1995. 15. ACR - American College of Radiology. Magnetic resonance imaging (MRI) quality control manual. Reston, VA: American College of Radiology; 2001. 16. Wood ML, Price RR. Quality control programs for MRI. In: The physics of MRI: 1992 AAPM Summer School Proceedings. American Institute of Physics. 1993; Medical Physics Monograph No. 21;53:718-53. 17. Lerski R, de Wilde J, Boyce D, et al. IPEM Publication, Report No. 80 - Quality control in magnetic resonance imaging. York, UK: Institute of Physics and Engineering in Medicine; 1998. 18. ONA - Organização Nacional de Acreditação: Selo de Qualificação ONA. [cited 2015 June 6]. Available from: https://www.ona.org.br/Pagina/306/Selo-de-Qualificacao-ONA 19. CBR - Colégio Brasileiro de Radiologia e Diagnóstico por Imagem. Normas Básicas para Inscrição no Programa de Qualidade em Ressonância Magnética [cited 2015 June 6]. Available from: http://cbr.org.br/wp-content/uploads/2013/05/Normativa-Resson--nciaMagn--tica-06.11.14.pdf 20. Mazzola AA, Herdade SB, Koch HA, et al. Protocolo de testes de aceitação em equipamentos de imagem por ressonância magnética. Radiol Bras. 2005;38:195-204. 21. The Phantom Laboratory. Magphan® manual. Greenwich, NY: The Phantom Laboratory Inc.; 2010. 22. RadiAnt DICOM Viewer. [cited 2014 Apr 17]. Available from: http://www.radiantviewer.com/radiant-dicom-viewer-standard.php 23. Kellgren JH, Lawrence JS. Radiological assessment of osteo-arthrosis. Ann Rheum Dis. 1957;16:494-502. 1. MD, MSc, Physicist, Doctoral Student in Clinical Radiology, Department of Diagnostic Imaging, Escola Paulista de Medicina da Universidade Federal de São Paulo (EPM-Unifesp), São Paulo, SP, Brazil 2. Physicist, Hospital São Paulo, São Paulo, SP, Brazil 3. Associate Professor Emeritus, Escola Paulista de Medicina da Universidade Federal de São Paulo (EPM-Unifesp), São Paulo, SP, Brazil Mailing address: Tiago da Silva Jornada EPM-Unifesp, Departamento de Diagnóstico por Imagem Rua Napoleão de Barros, 800, Vila Clementino São Paulo, SP, Brasil, 04024-002 E-mail: tiagosjornada@gmail.com Received February 19, 2015. Accepted after revision July 3, 2015. Study conducted in the Department of Diagnostic Imaging at the Escola Paulista de Medicina da Universidade Federal de São Paulo (EPM-Unifesp), São Paulo, SP, Brazil. |
|
Av. Paulista, 37 - 7° andar - Conj. 71 - CEP 01311-902 - São Paulo - SP - Brazil - Phone: (11) 3372-4544 - Fax: (11) 3372-4554