Radiologia Brasileira - Publicação Científica Oficial do Colégio Brasileiro de Radiologia
AMB - Associação Médica Brasileira CNA - Comissão Nacional de Acreditação
 Vol. 48 nº 1 - Jan. /Feb. of 2015
|
ORIGINAL ARTICLE
|
|
Comparison of standardized uptake values measured on 18F-NaF PET/CT scans using three different tube current intensities |
|
|
Autho(rs): Agnes Araujo Valadares1; Paulo Schiavom Duarte2; Eduardo Bechtloff Woellner1; George Barberio Coura-Filho2; Marcelo Tatit Sapienza3; Carlos Alberto Buchpiguel4 |
|
|
Keywords: 18F-NaF PET/CT; SUV; Tube current; mAs. |
|
|
Abstract: INTRODUCTION
Sodium fluoride (18F-NaF) is a highly sensitive bone-seeking tracer utilized in positron emission tomography (PET) to detect skeletal abnormalities. The 18F-fluoride uptake mechanism resembles that of 99mTc-MDP with better pharmacokinetic characteristics including faster blood clearance and two-fold higher uptake in bone(1). In the last years there was a renewed clinical interest in the use of 18F-NaF as a bone scanning agent(2). Reasons for this resurgence include the recent periodic worldwide shortage of 99mTc needed for conventional bone scanning agents(3), and the improved sensitivity(4-6) and quantitative potential of 18F-NaF PET/CT(7,8) as compared with 99mTc-based conventional bone scans. In PET/CT apparatuses, computed tomography (CT) images may be acquired for attenuation correction of emission images, anatomic localization of scintigraphic findings and radiographic characterization of abnormalities(9). The CT protocol depends on the indications for the study besides the likelihood that radiographic findings will add diagnostic information. However, the need for additional diagnostic information should always be weighed against the increased radiation exposure involved in CT, and dose parameters should be consistent with the ALARA (as low as reasonably achievable) principles. Due to the high bone-to-soft tissue activity ratio of 18F-NaF bone scans, high quality images may be obtained even without CT for attenuation correction(10,11). Nevertheless, the addition of CT seems to improve the 18F-NaF PET specificity(4,5) and allows for calculation of SUVs(12). SUV, which averages tracer uptake with respect to the injected dose and body weight, is the most widely used PET index for assessing tracer uptake in the routine clinical practice because it does not require blood sampling and is obtained by static PET acquisition(12-14). Research reports demonstrate that SUVs can detect significant metabolic change in individual metastatic lesions even in cases where visual evaluation reveals little if any difference(7). Additionally, in the field of oncology, earlier identification of metastatic involvement is possible and, in cases where it is important to assess the treatment response, quantitation may provide such information(7,8). The tube current intensity (mAs) to be used in patients undergoing 18F-NaF PET/CT scans has been subject of debate. The "SNM guideline for sodium 18F-fluoride PET/CT bone scans" has established 30 mAs as an adequate current intensity for whole body CT(1). However, there are scarce studies in the literature on the most appropriate mAs values. In the literature it is possible to find values ranging from 15 mAs(15) to 95 mAs(16). Therefore, it is necessary to evaluate the adequate mAs values in light of current advances in technology as well as the ALARA principles. The purpose of this study was to analyze SUVs using three different mAs intensities on CT scans for performing attenuation correction on 18F-NaF PET/CT studies. MATERIALS AND METHODS Patient population In the present cross sectional study, the images of the first 254 patients submitted to 18F-NaF PET/CT scans in the author's department were analyzed. The patients were randomly allocated to undergo scans using three different mAs intensities. The patients' characteristics: weight, height, body mass index, age and sex were analyzed. Also, the statistical differences in such patients' characteristics among mAs groups were analized. PET/CT images acquisition The patients were injected with 111 to 203 MBq (mean 141 MBq) of 18F-NaF. Approximately 60 min after injection, all patients underwent whole-body (vertex to toes) three-dimensional PET/CT scan. Images were acquired in a time-of-flight capable Discovery 690 GE scanner (General Electric). Low-dose CT transmission scans were performed using one of three intensities of mAs values (10, 20 or 30 mAs) for attenuation correction. Other CT images parameters were the following: 120 kVp, 0.5-s rotation time, 1.375 pitch and axial slice thickness of 3.75 mm. Emission PET images were acquired at 1 min per bed position (15 cm slice thickness and 3 cm overlapping), with 13 to 15 bed positions per study. The PET image reconstruction was performed using iterative technique with 24 subsets for all studies. Image analysis A total of 254 PET/CT studies were analyzed: 73 with 10 mAs, 83 with 20 mAs and 98 with 30 mAs. The SUV values were calculated in volumes of interest (VOIs) drawn on three skeletal regions, namely: right proximal humeral diaphysis (RH), right proximal femoral diaphysis (RF), and first lumbar vertebra (LV1) in a total of 712 VOIs (Figure 1). Such regions were assessed for the presence of bone alterations and the ones classified as abnormal were excluded from analysis. Thus, 675 regions classified as normal were analyzed (236, 232 and 207 in RH, RF and LV1, respectively). All SUVs were based on body weight. 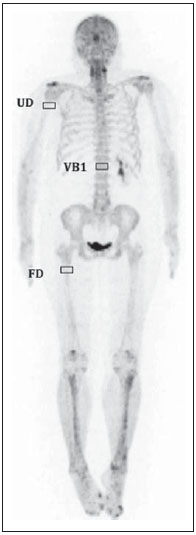 Figure 1. Volumes of interest drawn on three skeletal regions as follows: right proximal humeral diaphysis (UD), right proximal femoral diaphysis (FD), and first lumbar vertebra (VB1). Statistical analysis The ANOVA statistical test was used to assess the presence of statistical significant difference in SUVs values among the three mAs intensities groups for each one of the three skeletal regions. Also, the ANOVA (continuous variables) and chi-square (dichotomous variables) tests were utilizedo to assess the presence of statistical significant difference in patients' characteristics among mAs groups. The analyses were performed using Windows Excel® and SPSS®. RESULTS No statistically significant difference was observed in the patients' characteristics (weight, height, body mass index, age and sex) among groups (p > 0.05) (Table 1). 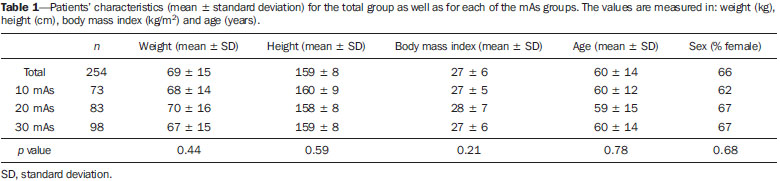 The mean SUV for each skeletal region as well as the number of patients analyzed in each mAs group are demonstrated on Table 2. The ANOVA did not show any statistically significant difference between mAs intensities groups for any one of the three skeletal regions (Table 2). 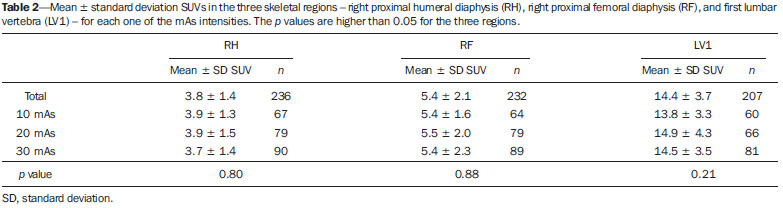 DISCUSSION 18F-NaF was introduced as an imaging agent for bone lesions by Blau et al.(17) in 1962. Data from multiple small studies have shown that 18F-NaF PET yields bone scans with higher sensitivity and specificity than 99mTc-based bone scans(18-22), and it is also superior to 18F-FDG PET/CT and MRI(23). The attenuation correction technique is normally used in PET studies to improve both quantification and uniformity in the field of view. Disadvantages of attenuation correction include errors arising from positional mismatches caused by patient motion or respiration differences, while its effect on lesion detection remains unclear. Because of low background uptake, there are few advantages of attenuation correction for bone scanning(10,11). Also, CT scanning is useful for anatomic localization of the lesions(4,5) and also to calculate SUV(12). However, the level of mAs on 18F-NaF or 18F-FDG PET/CT studies is a matter of discussion and a wide range of values may be found in the literature(15,16). With the use of phantoms, some researchers have demonstrated that CT tube current intensity as low as 10 mAs could be appropriate to perform attenuation correction on PET/CT studies(24,25). However, analyses in clinical studies are rare. As regards phantoms analyses, Fahey et al.(24) have evaluated the dose from the CT portion of PET/CT to determine minimum CT acquisition parameters that provide adequate attenuation correction. Such authors have concluded that, for pediatric patients, adequate attenuation correction can be obtained with very-low-dose CT (80 kVp and 5 mAs), and such correction leads to a 100-fold dose reduction as compared with diagnostic CT. For adults undergoing CT with 5 mAs, the tube voltage should to be increased to 120 kVp to prevent undercorrection. Alessio et al.(25) have also used phantoms to analyze the impact of mAs and kVp on radiation exposure. For the smallest patients, such authors decided to use 10 mAs, which is close to the lowest allowable tube current (5 mAs) on the PET/CT equipment available in their department. The feasibility of using very low mAs to calculate SUV in FDG PET/CT clinical studies was assessed by Kamel et al.(26). Such authors have evaluated the effect of decreasing the tube current (ranging from 10 to 120 mAs) on the appropriateness of CT-based attenuation correction and its effect of tumor quantification in FDG PET studies, demonstrating that there was no substantial difference in the estimates of 18F-FDG uptake or tumor size with varying tube current. It is worth to say that besides implications in terms of reduction of radiation dose, the use of low mAs value might also reduce costs as the use of low current intensity extends the mean service life,of the tube that is the most expensive component of the CT system. This cost reduction is particularly important in 18F-NaF PET/CT since the CT scans are performed throughout the whole body length and not only from the skull base to the upper part of the tight as in 18F-FDG PET/CT studies. Finally, the three mAs intensities analyzed seem to be similar for attenuation correction in the calculation of SUV for 18F-NaF PET/CT studies, and the use of a very low tube current intensity as 10 mAs is appropriate to calculate such a parameter. REFERENCES 1. Segall G, Delbeke D, Stabin MG, et al. SNM practice guideline for sodium 18F-fluoride PET/CT bone scans 1.0. J Nucl Med. 2010;51:1813-20. 2. Grant FD, Fahey FH, Packard AB, et al. Skeletal PET with 18Ffluoride: applying new technology to an old tracer. J Nucl Med. 2008;49:68-78. 3. Perkins A, Hilson A, Hall J. Global shortage of medical isotopes threatens nuclear medicine services. BMJ. 2008;337:a1577. 4. Even-Sapir E, Metser U, Flusser G, et al. Assessment of malignant skeletal disease: initial experience with 18F-fluoride PET/CT and comparison between 18F-fluoride PET and 18F-fluoride PET/CT. J Nucl Med. 2004;45:272-8. 5. Even-Sapir E, Metser U, Mishani E, et al. The detection of bone metastases in patients with high-risk prostate cancer: 99mTc-MDP Planar bone scintigraphy, single- and multi-field-of-view SPECT, 18F-fluoride PET, and 18F-fluoride PET/CT. J Nucl Med. 2006;47:287-97. 6. Kruger S, Buck AK, Mottaghy FM, et al. Detection of bone metastases in patients with lung cancer: 99mTc-MDP planar bone scintigraphy, 18F-fluoride PET or 18F-FDG PET/CT. Eur J Nucl Med Mol Imaging. 2009;36:1807-12. 7. Cook G Jr, Parker C, Chua S, et al. 18F-fluoride PET: changes in uptake as a method to assess response in bone metastases from castrate-resistant prostate cancer patients treated with 223Ra-chloride (Alpharadin). EJNMMI Res. 2011;1:4. 8. Doot RK, Muzi M, Peterson LM, et al. Kinetic analysis of 18Ffluoride PET images of breast cancer bone metastases. J Nucl Med. 2010;51:521-7. 9. Delbeke D, Coleman RE, Guiberteau MJ, et al. Procedure guideline for tumor imaging with 18F-FDG PET/CT 1.0. J Nucl Med. 2006;47:885-95. 10. Nagarajah J, Dannat T, Hartung V. et al. 18F-fluoride PET/CT for bone scanning. Role of attenuation correction. Nuklearmedizin. 2012;51:84-7. 11. Tayama Y, Takahashi N, Oka T, et al. Clinical evaluation of the effect of attenuation correction technique on 18F-fluoride PET images. Ann Nucl Med. 2007;21:93-9. 12. Brenner W, Vernon C, Muzi M, et al. Comparison of different quantitative approaches to 18F-fluoride PET scans. J Nucl Med. 2004;45:1493-500. 13. Puri T, Blake GM, Frost ML, et al. Comparison of six quantitative methods for the measurement of bone turnover at the hip and lumbar spine using 18F-fluoride PET-CT. Nucl Med Commun. 2012;33:597-606. 14. Even-Sapir E, Mishani E, Flusser G, et al. 18F-Fluoride positron emission tomography and positron emission tomography/computed tomography. Semin Nucl Med. 2007;37:462-9. 15. Suenaga H, Yokoyama M, Yamaguchi K, et al. Time course of bone metabolism at the residual ridge beneath dentures observed using (1)(8)F-fluoride positron emission computerized-tomography/computed tomography (PET/CT). Ann Nucl Med. 2012;26:817-22. 16. Chen CJ, Ma SY. Prevalence of clinically significant extraosseous findings on unenhanced CT portions of (1)(8)F-fluoride PET/CT bone scans. ScientificWorldJournal. 2012;2012:979867. 17. Blau M, Nagler W, Bender MA. Fluorine-18: a new isotope for bone scanning. J Nucl Med. 1962;3:332-4. 18. Hetzel M, Arslandemir C, Konig HH, et al. F-18 NaF PET for detection of bone metastases in lung cancer: accuracy, cost-effectiveness, and impact on patient management. J Bone Miner Res. 2003;18:2206-14. 19. Hoh CK, Hawkins RA, Dahlbom M, et al. Whole body skeletal imaging with [18F]fluoride ion and PET. J Comput Assist Tomogr. 1993;17:34-41. 20. Langsteger W, Heinisch M, Fogelman I. The role of fluorodeoxyglucose, 18F-dihydroxyphenylalanine, 18F-choline, and 18F-fluoride in bone imaging with emphasis on prostate and breast. Semin Nucl Med. 2006;36:73-92. 21. Schirrmeister H, Guhlmann A, Kotzerke J, et al. Early detection and accurate description of extent of metastatic bone disease in breast cancer with fluoride ion and positron emission tomography. J Clin Oncol. 1999;17:2381-9. 22. Schirrmeister H, Glatting G, Hetzel J, et al. Prospective evaluation of the clinical value of planar bone scans, SPECT, and (18)F-labeled NaF PET in newly diagnosed lung cancer. J Nucl Med. 2001;42:1800-4. 23. Iagaru A, Young P, Mittra E, et al. Pilot prospective evaluation of 99mTc-MDP scintigraphy, 18F NaF PET/CT, 18F FDG PET/CT and whole-body MRI for detection of skeletal metastases. Clin Nucl Med. 2013;38:e290-e296. 24. Fahey FH, Palmer MR, Strauss KJ, et al. Dosimetry and adequacy of CT-based attenuation correction for pediatric PET: phantom study. Radiology. 2007;243:96-104. 25. Alessio AM, Kinahan PE, Manchanda V, et al. Weight-based, low-dose pediatric whole-body PET/CT protocols. J Nucl Med. 2009;50:1570-7. 26. Kamel E, Hany TF, Burger C. et al. CT vs 68Ge attenuation correction in a combined PET/CT system: evaluation of the effect of lowering the CT tube current. Eur J Nucl Med Mol Imaging. 2002;29:346-50. 1. Nuclear Physicians, Hospital das Clínicas da Faculdade de Medicina da Universidade de São Paulo (HC-FMUSP), São Paulo, SP, Brazil 2. PhDs, Physicians Assistants, Instituto do Câncer do Estado de São Paulo Octavio Frias de Oliveira (Icesp), São Paulo, SP, Brazil 3. Private Docent, Professor, Department of Radiology and Oncology Faculdade de Medicina da Universidade de São Paulo (FMUSP), São Paulo, SP, Brazil 4. Private Docent, Full Professor, Department of Radiology and Oncology Faculdade de Medicina da Universidade de São Paulo (FMUSP), São Paulo, SP, Brazil Mailing Address: Dra. Agnes Araujo Valadares Avenida Doutor Arnaldo, 251, 4º Subsolo (Medicina Nuclear), Cerqueira César São Paulo, SP, Brazil, 01246-000 E-mail: agnesvaladares@me.com Received April 22, 2014. Accepted after revision July 8, 2014. Study developed at Unit of Nuclear Medicine Instituto do Câncer do Estado de São Paulo Octavio Frias de Oliveira (Icesp), São Paulo, SP, Brazil. |
|
Av. Paulista, 37 - 7° andar - Conj. 71 - CEP 01311-902 - São Paulo - SP - Brazil - Phone: (11) 3372-4544 - Fax: (11) 3372-4554