Radiologia Brasileira - Publicação Científica Oficial do Colégio Brasileiro de Radiologia
AMB - Associação Médica Brasileira CNA - Comissão Nacional de Acreditação
 Vol. 46 nº 5 - Sep. / Oct. of 2013
|
ORIGINAL ARTICLE
|
|
The role of ultrasonography in the measurement of subcutaneous and visceral fat and its correlation with hepatic steatosis |
|
|
Autho(rs): Roberto Velloso Eifler |
|
|
Keywords: Abdominal fat; Steatosis; Metabolic syndrome; Ultrasonography. |
|
|
Abstract: INTRODUCTION
In the last decades, particularly in the recent years, the rate of obesity has increased among the populations in developed and emerging Western countries, both in children and adults(1). Early in the eighties, Reaven(2) observed that obesity was many times associated with diseases such as arterial hypertension, hyperglycemia, dyslipidemia and, mainly, that such hemodynamic and metabolic alterations had a common connection with insulin resistance. Based on such observations the concept of metabolic syndrome (MS) was consolidated. The prevalence of MS is currently estimated to be between 20% and 25% of the general population, with increasing indices(3). The relevance of the diagnosis of MS became clear once its relationship with cardiovascular diseases was confirmed. Individuals with MS present two to three times greater risk for cardiovascular morbidity than individuals without MS(4). Non alcoholic fatty liver disease (NAFLD) corresponds to the clinical manifestation of metabolic syndrome, covering a wide spectrum of liver lesions from benign steatosis to non alcoholic steatohepatitis (NASH) with high risk for progression to cirrhosis and hepatocellular carcinoma(5). NAFLD can be diagnosed by imaging studies such as ultrasonography (US), computed tomography (CT) and magnetic resonance imaging (MRI). Although US demonstrates lower accuracy than CT and MRI in the detection of NAFLD, the low cost and easy make this method the most utilized diagnostic tool in the initial evaluation of liver parenchymal alterations(6). US, like CT and MRI, cannot differentiate steatosis from NASH, which still remains as a capacity of the histopathological study(7). However, steatosis can be quantified by US as mild (grade 1), moderate (grade 2) and severe (grade 3), and such quantification is fairly correlated with CT, MRI and histopathological analysis(8,9). According to some authors(10), US may present 89% sensitivity and 93% specificity in the identification of steatosis. On the other hand, other authors report sensitivity up to 94% and specificity up to 100%(11). The criteria for quantifying steatosis present little variations among the several authors. The classification proposed by Saadeh et al.(9) is a good example: - Grade 1 (mild): diffuse increase in liver echogenicity, with normal visualization of intrahepatic vessels and of the diaphragm. Recent studies correlating US with histopathological analysis confirm that US is a relevant noninvasive tool for evaluating NAFLD(12,13) and intend to demonstrate that the normal or grade 1 liver echogenicity rules out NAFLD and removes the necessity of liver biopsy(14,15). In the last years, another important role has been assigned to US in the evaluation of MS, besides the quantification of steatosis. As already seen, obesity is closely related to the diagnosis of MS. On the other hand, it was observed that obesity, as usually evaluated by anthropometric measurements, presented idiosyncrasies, for example, individuals with low body mass índex might present high incidence of typical alterations of MS. This has called the attention to the fact that the fat distribution, rather than the total excess of fat, would be related to the insulin resistance and, consequently, to the metabolic syndrome(3). Since then, the relationship between subcutaneous/gluteofemoral/visceral fat and the insulin action have been studied extensively and nowadays one can affirm that at least the association between visceral fat and MS components is already well established(16,17). Imaging studies are the methods of choice to evaluate and quantify visceral fat. In 1983, Tokunaga et al. established criteria for evaluating body fat by CT. Currently, CT is considered as the gold standard for evaluating intra-abdominal fat (16), but in truth it is highly expensive, lacks practicality and exposes the patient to ionizing radiation. Criteria for evaluating visceral fat with good accuracy by MRI were also developed, but this method, more than CT, is subjected to artifacts and, also, its variation coefficient is also higher(18). Anthropometric measurements are most frequently utilized in the evaluation of body fat, but such method has demonstrated to be incapable of differentiating visceral from subcutaneous fat, besides the relatively high intra and interobserver variability(19). In contrast to the disadvantages of CT, MRI and anthropometric measurements, US has shown to be a simple, low-cost method without radiation risk, and with already proved reproducibility and reliability in the quantification of visceral fat(20-22). The sonographic technique consists in separately measuring the abdominal, subcutaneous and visceral fat thickness with a 3-4 MHz transducer placed 1 cm above the umbilical scar. The studies developed by Armellini et al.(20) have demonstrated that the visceral fat thickness measured by this technique is fairly correlated with the area of such tissue quantified by CT. In 2002, Leite et al. defined the values of 8 cm as visceral fat thickness for women and 9 cm for men as associated with a higher cardiovascular risk(23). In 2003, Ribeiro Filho et al. proposed the value of 7 cm for the diagnosis of visceral obesity in women(24). In 2009, Diniz et al., in a study involving 50 patients indistinct of gender, established mean values with respective standard deviations corresponding to 2.64 cm ± 1.37 for subcutaneous fat thickness and 6.84 cm ± 2.38 for visceral fat thickness(25). Considering the author's activities involving US in the investigation of gastroenterological conditions, the mentioned studies originality, simplicity and efficaciousness have called his attention. However, such studies have called the author's attention principally because of the fact that, in spite of showing a promising pathway, most of them remained as isolated experiments lacking follow-up. The author's conclusion is that this is a further example of what happens nowadays in the medicine field: the knowledge compartmentalization. The evaluation of visceral fat is highly interesting for different medical specialties such as gastroenterology, hepatology, endocrinology, cardiology and other medical specialties devoted to the study of obesity and metabolism. However, it is not included in the sonographic routine. Sonographists follow correct protocols which, however, are failing in meeting the specific necessities of an increasing number of specialties. The author's objective is adding information to the work of those researchers, particularly the Brazilian ones, such as Leite et al.(23), Ribeiro Filho et al.(24) and Diniz et al.(25), who are concerned in defining normal and risk values for subcutaneous and visceral fat thickening. The correlation with the grade of steatosis established by US, whose criterion is already well defined, will be utilized by the authors of the present study for determining a cutoff value to identify those individuals with at higher risk for steatohepatitis. MATERIALS AND METHODS In the present study, 365 patients of a clinic specialized in gastroenterology in Porto Alegre, RS, Brazil were consecutively and randomly assessed regardless of their complaints and symptoms, in the period from October 15, 2012 to January 25, 2013. Only chronic diseases such as alcoholism, cirrhosis, lymphoma, and renal failure, besides history of bariatric or aesthetic surgery determined exclusion from the present study. All the patients were evaluated by an experienced sonographist whose daily practice at least for ten years has involved the quantification of steatosis and during the preceding ten months had measured subcutaneous and visceral fat on a daily basis. The measurement of perirenal fat was not considered because of its still controversial reproducibility. The scans were performed with a single Toshiba Nemio XG US apparatus with a convex, 3-4 MHz transducer. The utilization of a linear transducer for measuring subcutaneous fat was not considered necessary since the differences between measurements with convex and linear transducers were non-significant, so the technique proposed by Radominski et al.(21) was utilized. The criteria for steatosis quantification followed the classification developed by Saadeh et al.(9), except for the classification of mild steatosis (grade 1) where the presence of small focal hypoechoic areas on the liver parenchyma, particularly in the periportal and perivascular regions, prevailed over the distinction between the hepatic echotexture and the right kidney cortex echotexture which is fairly dependent on subjectivity and on an ideally standardized renal echotexture. Focal hypoechoic areas are caused by venous systems (generally cholecystic or parabiliary) independent or relatively independent from the portal system which locally reduce the portal perfusion and, consequently, determine focal metabolic changes which generate areas free from adipose tissue accumulation(26). Measurements of subcutaneous and visceral fat thickness were performed with the patient positioned in dorsal decubitus and right arm elevation, and the convex 3-4 MHz transducer cross-sectionally placed on the midline, 1 cm above the umbilical scar, during the expiratory phase, without pressure on the abdomen in order not to distort the measurement(25). Subcutaneous fat thickness corresponded to the distance in centimeters between the skin and the anterior surface of the linea alba which is the tendinous raphe that unites the two halves of the rectus abdominus muscle. Visceral fat thickness corresponded to the distance in centimeters between the posterior surface of the linea alba and the plane of the posterior aortic wall (Figure 1). It is convenient to observe that the linea alba is many times thick, allowing the distinction between the anterior and posterior surfaces, or many times thin, showing up on the images as a trace. In the latter case, the trace is considered as the anterior and posterior surfaces for the purpose of measurement. Generally, there is accumulation of extra-peritoneal fat on the midline, right under the linea alba, showing up as hypoechoic and ellipsoid image; for the purposes of measurement, such fat is included in the visceral fat thickness. The aorta is usually located at left from the midline, and once its image is identified, a horizontal line is drawn, passing through its posterior wall up to the midline. At the intersection of such a line with the line from the linea alba (first caliper) the second caliper is positioned to measure the visceral fat thickness. 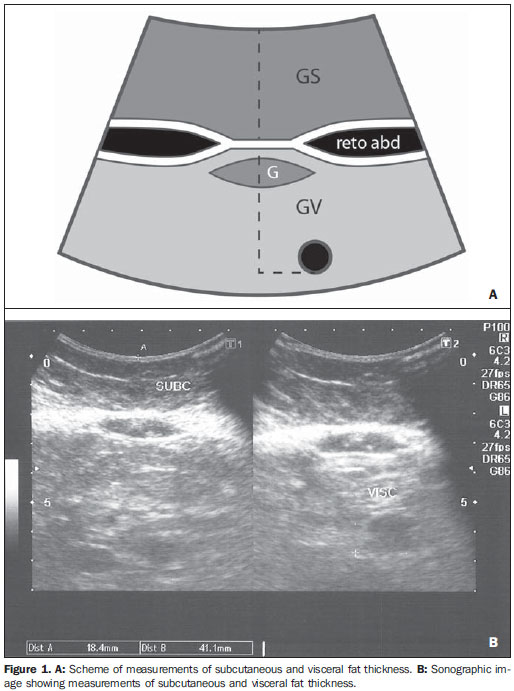 Figure 1. A: Scheme of measurements of subcutaneous and visceral fat thickness. B: Sonographic image showing measurements of subcutaneous and visceral fat thickness. RESULTS In the present study, 365 patients in the age range between 16 and 92 years (mean 52.9 years) were evaluated, and a correlation was established between the patients' sex and presence of steatosis (Table 1). 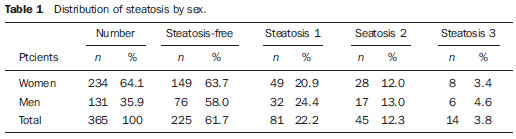 About 38% of the study population presented steatosis, without statistically significant difference between men and women. Based on data showing that US may present high sensitivity and specificity in the identification of steatosis(11), and considering that normal liver echogenicity practically rules out histological NAFLD(14,15), subcutaneous and visceral fat thicknesses were evaluated in steatosis-free individuals. For the women the subcutaneous fat thickness was 2.51 cm ± 1.94, and for the men, 2.14 cm ± 1.38 (p = 0.004; Student t test). Visceral fat thickness was 5.38 cm ± 2.74 for the women and 6.78 cm ± 2.66 for the men (p < 0.001; Student t test). It was possible to observe that the subcutaneous fat is on average 17% thicker in women than in steatosis-free men. On the other hand, visceral fat was on average 26% thicker in men than in steatosis-free women. On the basis of such data, the authors decided to pay special attention to the difference between men and women as subcutaneous and visceral fat were quantified per age range. Female individuals Based on studies demonstrating that obesity presents its highest peak between the ages of 45 and 64 years, 149 steatosisfree women were evaluated up to achieve a definitive distribution among three distinctive and more homogeneous age groups (Table 2). 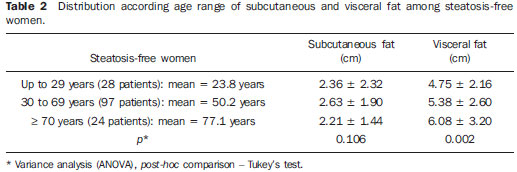 The mean visceral fat thickness for all the 149 steatosis-free women was 5.38 cm ± 2.74. No statistically significant variation was observed in subcutaneous fat thickness among age groups in steatosis-free women. The 85 women with steatosis were distributed according the degree of fatty infiltration (Table 3). 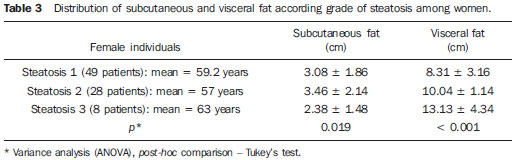 A progressive and statistically significant increase in visceral fat thickness was observed with the increase in the grade of steatosis in women. On the other hand, the subcutaneous fat thickness did not present any relevant alteration among the different grades of steatosis. Male individuals As among women, the sample of 131 male steatosis-free patients was divided into three age groups (Table 4). 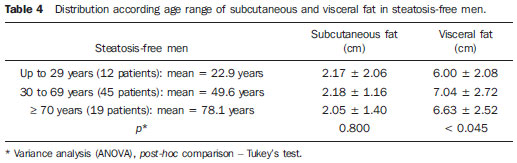 Also, no significant variation was demonstrated in subcutaneous fat thickness in the different age groups among steatosisfree men. Despite the statistical significance observed as regards visceral fat thickness variation among age groups, such variation was not considered as clinically relevant. Mean visceral fat thickness for all the steatosis-free men was 6.78 cm ± 2.66. The 55 men with steatosis were distributed according to degree of fatty infiltration (Table 5). 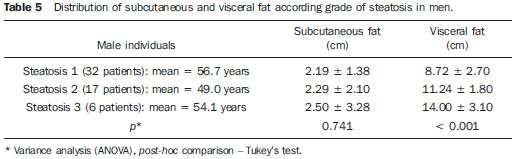 Similarly to the women, subcutaneous fat thickness among the different grades of steatosis in men did not present any statistically significant difference. On the other hand, a progressive and statistically significant increase in visceral fat thickness was observed with the increase in steatosis. Statistical analysis Subcutaneous fat was disregarded for lacking statistical significance, and the analysis regarding visceral fat thickness was based on the area under the ROC curve to define: a) cut-off value among steatosisfree individuals and individuals with mild steatosis (S1); b) an optimum cut-off value among individuals at no risk and individuals at risk for steatohepatitis. For this purpose, the authors have opted for utilizing the group of steatosis-free and S1 individuals as a reference against which to appraise the group including individuals with moderate (S2) and severe (S3) steatosis, according to the study developed by Shannon et al.(15), which has demonstrated that 92% of patients with S2 and S3 at US presented moderate to severe steatosis at biopsy; and that most steatosis-free patients or patients with S1 at US did not present any steatosis or presented only mild steatosis at biopsy. The results are shown on Table 6. 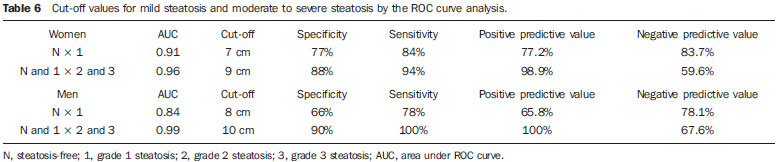 DISCUSSION Considering that the prevalence of both MS(3) and NAFLD(27) is around 20% to 25% in the general population, and that, in patients with NAFLD selected for liver biopsy (criterion: steatosis at US and TGP/TGO serum levels > 1.5 above the normal level in more than two occasions at a one-month interval), steatohepatitis without fibrosis may affect 31.1% of the individuals, and steatohepatitis with fibrosis may reach 27% of cases(28), the authors have tried to establish a noninvasive, low-cost method to aid in the identification of patients at higher risk for presenting the progressive forms of such diseases. With basis on the US accuracy to detect steatosis(10,11), one should consider the possibility of utilizing such imaging method as an initial tool in the screening for NAFLD even in the presence of normal levels of hepatic enzymes(15). On the other hand, considering the relationship between steatosis and visceral fat thickness(13,25), the author has tried to define values for abdominal fatty tissue thickness that could differentiate normality from mild steatosis and suspicion of steatohepatitis(14). It has already been demonstrated that the accumulation of visceral fat is related to the development of steatohepatitis, and that such accumulation continuously influences histological alteration in NAFLD from early in the process of fat deposition in hepatocytes to the onset of inflammatory alterations(29). One of the advantages of measuring the visceral fat thickness is the simplicity and objectiveness of the method, allowing the avoidance of subjective variables in the quantification of steatosis that is very operator dependent. Both steatosis and abdominal visceral fat are correlated independently of cardiometabolic risk, but the associations are stronger for visceral fat than for steatosis(30). In the 365 patients included in the present study, no statistically significant difference was observed in subcutaneous fat thickness between male and female individuals, age groups and in relation to the presence or not of steatosis. On the other hand, visceral fat thickness did not present any statistically significant difference between age groups in steatosis-free men, but, among women, it did present a significant increase between young (< 29 years) and adult women, and between adult and elderly women (> 70 years). However, among patients with steatosis, visceral fat thickening presented significant increase, proportional to the grade of steatosis, both in men and women. Based on the ROC curve analysis, the following cut-off values were obtained: 1. For women, visceral fat thickness > 7 cm suggests the presence of mild steatosis; and > 9 cm suggests moderate to severe steatosis with risk for steatohepatitis and metabolic syndrome. 2. For men, visceral fat thickness > 8 cm suggests the presence of mild steatosis; and > 10 cm, suggests moderate to severe steatosis with risk for steatohepatitis and metabolic syndrome. The risk for steatohepatitis with visceral fat thickness > 9 cm for women and > 10 cm for men raises the possibility of indication for liver biopsy. Such values practically superimpose themselves on those reported by Leite et al.(23), who have studied 422 patients, investigating the correlation between visceral fat thickness and cardiovascular risk. Such study has indicated a cut-off value of 7 cm to predict a moderate cardiovascular risk for both female and male individuals, while the present study has found a cut-off value of 7 cm for women and 8 cm for men to indicate the presence of mild steatosis. The study developed by Leite et al.(23) has also defined cut-off values of 8 cm for women and 9 cm for men to predict high cardiovascular risk. The present study has established cut-off values of 9 cm for women and 10 cm for men to predict high risk for steatohepatitis. Ribeiro Filho et al.(24), who have also developed an exemplary study correlating visceral fat thickness with metabolic syndrome components, have assessed 100 female patients, defining 7 cm as cut-off value above which the patients present cardiovascular risk. As regards the study developed by Diniz et al.(25) intended principally to evaluate the interobserver variability of the sonographic method, the fact of not having differentiated men and women as well as grades of steatosis puts their values obtained for visceral fat thickness (6.84 cm ± 2.38) within the spectrum of the present study. Previous studies approaching the evaluation of visceral fat by US are practically concentrated on validating US as compared with CT, MRI and anthropometry. Armellini et al.(20), for example, is the first reference for all studies involving visceral fat and US, and even utilized three different parameters to measure visceral fat from the linea alba: the splenic vein, the anterior aortic wall and the posterior aortic wall. Currently, the posterior aortic wall is utilized because it is believed that intra-abdominal thickness values based on such parameter are more representative of the visceral fat amount. The measurement of subcutaneous fat thickness did not demonstrate to be statistically relevant neither in men nor in women. It may be utilized as treatment follow-up in individual cases. In spite of the apparent disparity between the increase in visceral fat and increase in subcutaneous fat with the progression of obesity, the proposition of an index to measure the visceral fat/subcutaneous fat ratio has not found statistical relevance. The limitation of the present study is related to the lack of correlation with serum parameters and with histological analysis. CONCLUSION The present study demonstrated the correlation between steatosis and measurement of visceral fat thickness in 365 patients, suggesting the preference for the latter in the evaluation of NAFLD, not only because of its objectiveness and reproducibility, but also because it allows the definition of differentiated quantitative criteria for men and women, as well as for different age groups. Additionally, it allows a more accurate treatment follow-up. As regards visceral fat, values were suggested for normality and risk for steatohepatitis for both male and female individuals. Furthermore, it is suggested that the measurement of visceral fat thickness is included in the routine abdominal ultrasonography studies, considering the practicality and efficaciousness of this method as a predictor of steatohepatitis and metabolic syndrome. REFERENCES 1. Ogden CL, Carroll MD, Curtin LR, et al. Prevalence of overweight and obesity in the United States, 1999-2004. JAMA. 2006;295:1549-55. 2. Reaven GM. Banting lecture 1988. Role of insulin resistance in human disease. Diabetes. 1988;37:1595-607. 3. Ribeiro Filho FF, Mariosa LS, Ferreira SRG, et al. Gordura visceral e síndrome metabólica: mais que uma simples associação. Arq Bras Endocrinol Metabol. 2006;50:230-8. 4. Isomaa B, Almgren P, Tuomi T, et al. Cardiovascular morbidity and mortality associated with the metabolic syndrome. Diabetes Care. 2001;24:683-9. 5. Farrell GC, Larter CZ. Nonalcoholic fatty liver disease: from steatosis to cirrhosis. Hepatology. 2006;43(2 Suppl 1):S99-112. 6. Ma X, Holalkere NS, Kambadakone RA, et al. Imaging-based quantification of hepatic fat: methods and clinical applications. Radiographics. 2009;29:1253-77. 7. Schwenzer NF, Springer F, Schraml C, et al. Non-invasive assessment and quantification of liver steatosis by ultrasound, computed tomography and magnetic resonance. J Hepatol. 2009;51:433-45. 8. Joy D, Thava VR, Scott BB. Diagnosis of fatty liver disease: is biopsy necessary? Eur J Gastroenterol Hepatol. 2003;15:539-43. 9. Saadeh S, Younossi ZM, Remer EM, et al. The utility of radiological imaging in nonalcoholic fatty liver disease. Gastroenterology. 2002;123:745-50. 10. Joseph AE, Saverymuttu SH, al-Sam S, et al. Comparison of liver histology with ultrasonography in assessing diffuse parenchymal liver disease. Clin Radiol. 1991;43:26-31. 11. Andrade JO, Andrade MHF, Andrade GF, et al. Quantification of liver echogenicity for ultrasonographic classification of nonalcoholic fatty liver disease. GED Gastroenterol Endosc Dig. 2006;25:159-64. 12. Dasarathy S, Dasarathy J, Khiyami A, et al. Validity of real time ultrasound in the diagnosis of hepatic steatosis: a prospective study. J Hepatol. 2009;51:1061-7. 13. Hamaguchi M, Kojima T, Itoh Y, et al. The severity of ultrasonographic findings in nonalcoholic fatty liver disease reflects the metabolic syndrome and visceral fat accumulation. Am J Gastroenterol. 2007;102:2708-15. 14. El-Koofy N, El-Karaksy H, El-Akel W, et al. Ultrasonography as a non-invasive tool for detection of nonalcoholic fatty liver disease in overweight/obese Egyptian children. Eur J Radiol. 2012;81:3120-3. 15. Shannon A, Alkhouri N, Carter-Kent C, et al. Ultrasonographic quantitative estimation of hepatic steatosis in children with NAFLD. J Pediatr Gastroenterol Nutr. 2011;53:190-5. 16. Yoshizumi T, Nakamura T, Yamane M, et al. Abdominal fat: standardized technique for measurement at CT. Radiology. 1999;211:283-6. 17. Wajchenberg BL. Subcutaneous and visceral adipose tissue: their relation to the metabolic syndrome. Endocr Rev. 2000;21:697-738. 18. van der Kooy K, Seidell JC. Techniques for the measurement of visceral fat: a practical guide. Int J Obes Relat Metab Disord. 1993;17:187-96. 19. Vasques ACJ, Priore SE, Rosado LEFPdL, et al. Utilização de medidas antropométricas para a avaliação do acúmulo de gordura visceral. Revista de Nutrição. 2010;23:107-18. 20. Armellini F, Zamboni M, Robbi R, et al. Total and intra-abdominal fat measurements by ultrasound and computerized tomography. Int J Obes Relat Metab Disord. 1993;17:209-14. 21. Radominski RB, Vezozzo DP, Cerri GG, et al. O uso da ultra-sonografia na avaliação da distribuição de gordura abdominal. Arq Bras Endocrinol Metabol. 2000;44:5-12. 22. Hirooka M, Kumagi T, Kurose K, et al. A technique for the measurement of visceral fat by ultrasonography: comparison of measurements by ultrasonography and computed tomography. Intern Med. 2005;44:794-9. 23. Leite CC, Wajchenberg BL, Radominski R, et al. Intra-abdominal thickness by ultrasonography to predict risk factors for cardiovascular disease and its correlation with anthropometric measurements. Metabolism. 2002;51:1034-40. 24. Ribeiro-Filho FF, Faria AN, Azjen S, et al. Methods of estimation of visceral fat: advantages of ultrasonography. Obes Res. 2003;11:1488-94. 25. Diniz ALD, Tomé RAF, Debs CL, et al. Avaliação da reprodutibilidade ultrassonográfica como método para medida da gordura abdominal e visceral. Radiol Bras. 2009;42:353-7. 26. Yoshimitsu K, Honda H, Kuroiwa T, et al. Unusual hemodynamics and pseudolesions of the noncirrhotic liver at CT. Radiographics. 2001;21 Spec No:S81-96. 27. Ong JP, Younossi ZM. Epidemiology and natural history of NAFLD and NASH. Clin Liver Dis. 2007;11:1-16, vii. 28. Cotrim HP, Parise ER, Oliveira CP, et al. Nonalcoholic fatty liver disease in Brazil. Clinical and histological profile. Ann Hepatol. 2011;10:33-7. 29. Eguchi Y, Mizuta T, Sumida Y, et al. The pathological role of visceral fat accumulation in steatosis, inflammation, and progression of nonalcoholic fatty liver disease. J Gastroenterol. 2011;46 Suppl 1:70-8. 30. Liu J, Fox CS, Hickson D, et al. Fatty liver, abdominal visceral fat, and cardiometabolic risk factors: the Jackson Heart Study. Arterioscler Thromb Vasc Biol. 2011;31:2715-22. MD, Specialist in Radiology and Imaging Diagnosis, Fundação Riograndense Universitária de Gastroenterologia (Fugast), Porto Alegre, RS, Brazil Mailing Address: Dr. Roberto Velloso Eifler Rua Cabral, 983/302, Rio Branco Porto Alegre, RS, Brazil, 90420-121 E-mail: eifler2010@hotmail.com Received March 7, 2013. Accepted after revision May 27, 2013. Study developed at the Unit of Ultrasonography, Fundação Riograndense Universitária de Gastroenterologia (Fugast), Porto Alegre, RS, Brazil. |
|
Av. Paulista, 37 - 7° andar - Conj. 71 - CEP 01311-902 - São Paulo - SP - Brazil - Phone: (11) 3372-4544 - Fax: (11) 3372-4554