Radiologia Brasileira - Publicação Científica Oficial do Colégio Brasileiro de Radiologia
AMB - Associação Médica Brasileira CNA - Comissão Nacional de Acreditação
 Vol. 44 nº 5 - Sep. / Oct. of 2011
|
ORIGINAL ARTICLE
|
|
Evaluation of morphometric parameters calculated from breast lesion contours at ultrasonography in the distinction among BI-RADS categories |
|
|
Autho(rs): Maria Julia Gregorio Calas1; André Victor Alvarenga2; Bianca Gutfilen3; Wagner Coelho de Albuquerque Pereira4 |
|
|
Keywords: Breast ultrasonography; BI-RADS; Computer-assisted image processing; Computer-assisted image interpretation. |
|
|
Abstract: INTRODUCTION
Nowadays, mammography is still the best method for early detection of breast cancer, with sensitivity ranging between 89% and 95%, provenly contributing to a 24% reduction of breast cancer mortality amongst women in the age range between 40 and 49 years, and 30% amongst women aged 50 years and over(1,2). However, the interpretation of mammograms poses a challenge for specialists, particularly in cases of dense breasts(1,2). One of the ways to increase the diagnostic accuracy mammography, particularly the specificity, is the comparison of the most recent images with the previous ones, besides the double reading, where a good interobserver agreement is required. Such practice is based on studies published in the literature demonstrating an increase of 7%15% in the number of detected lesions(1,2). Breast ultrasonography (US) plays a relevant role as a complement to mammography and clinical examination in the evaluation of breast diseases. Besides being capable to detect some initially suspicious lesions that might be missed at mammography, breast US can be useful in the differentiation between solid and cystic nodules as well as between benign and malignant nodules (35). Some lesion characteristics, such as orientation and echogenicity, are exclusively observed at US, and others, such as contour and shape, are critical in the image interpretation, the first one presenting higher sensitivity, and the second one, high specificity(69). Despite several advantages, such as absence of ionizing radiation, equipment portability, easy repeatability, and real time imaging capability, US results depend on the image quality, possibly leading to a high variability in the radiological interpretation by radiologists(1013). The literature also reports that the success in detecting a lesion at breast US is influenced by the operator fatigue, the breast size and by the lesion depth(1013). The adoption of a standardization in the description of breast lesions, such as the BI-RADS® lexicon, is important to standardize the terminology, to assist in the indication of the degree of malignancy suspicion according to the morphological echographic findings and, consequently, to allow a more accurate indication on the course of action to be adopted(35). Inter-and intraobserver studies have attracted the interest of breast radiology professionals. However, most of times, studies on agreement regarding breast images approach mammography, probably because the BI-RADS lexicon for such imaging modality is utilized since 1993, while for US it has been used for approximately eight years(14). Recently, studies about interobserver agreement on US presented kappa indices ranging between 0.28 (reasonable) and 0.83 (almost perfect) in a diagnosis essentially based on a subjective evaluation of morphological findings of a lesion(1417). But, despite the standardization allowed by BI-RADS, the sonographic study and respective diagnostic report are still operator-dependent tasks. The study of methods based on quantitative evaluations may be useful to reduce the degree of subjectivity and operator-dependence, considering that the quantification is not dependent on the operators experience(18). Thus, several studies have proposed methods to help in the diagnosis of breast cancer at US images, aiming at reducing the number of biopsies for benign solid lesions and increasing the consistency of diagnostic US images interpretation(1927). A key issue in the utilization of such methods is the segmentation an image processing technique aimed at separating the lesion under analysis from the rest of the image elements(28). Considering medical images, the segmentation of a region of interest is extremely difficult to be completed because of restrictions placed by the image acquisition process, the disease and biological variations(29). Particularly on US images, the segmentation becomes difficult because of their textured nature. Such a feature is a result of factors such as signal processing for image formation, interaction between the ultrasound wave and each type of biological tissue, speckle and artifacts(30). Once the lesion image is segmented, one can determine useful parameters to quantify morphological characteristics of breast lesions, such as contour and texture considered as being capable of differentiating malignant and benign lesions. It is important to note that the study of segmentation techniques, of parameters calculation as well as the determination of the best parameters to distinguish malignant from benign tumors, constitute complex tasks and still remain under investigation(19,20). The present study was aimed at evaluating the performance of morphometric parameters calculated from the contour of breast lesions at US, in the quantification of their morphological characteristics and in the differentiation among the BI-RADS categories 2, 3, 4 and 5. MATERIALS AND METHODS Images database The present casuistry includes 40 lesions from 40 patients in the age range between 16 and 88 years (mean = 50.7 years), submitted to surgery indicated by their assisting physicians. The previous US images were acquired in a Logic 5 (GE Medical Systems; Wisconsin, USA) equipment with a 12 MHz linear transducer. The lesions size ranged between 6.0 and 27.0 mm. The evaluation and classification of lesions according to the BI-RADS for US was performed by a single observer with 15-year experience in breast radiology(31). The observer compared the images with the respective histopathological reports, and classified the lesion as the most appropriate BI-RADS category. Such a procedure was adopted to minimize the classification variability, considering that such a classification would be the reference for evaluation of the morphometric parameters. It is important to highlight that, despite the previous knowledge on the histopathological results, the images analysis was mandatory to define the BI-RADS classification. In order to assure anonymity, the patients identification was replaced by a number previously to the analysis. The histopathological reports of the 40 surgical specimens were utilized as a gold standard and indicated the following malignant findings: 18 invasive ductal carcinomas, 1 invasive lobular carcinoma, 1 medullary carcinoma, and 1 carcinoma originated from metastasis; and the following benign findings: 12 fibroadenomas, 1 hyalinized fibroadenoma, 1 fibrocystic change, 4 cysts and 1 hematoma. Morphometric parameters In order to determine the lesions contour, the US images were segmented by means of methods of segmentation and contour determination based respectively on Watershed transformation and Average Radial Derivative(20). Examples of malignant and benign lesions contour determined by the segmentation and contour detection are shown on Figures 2A and 2B. 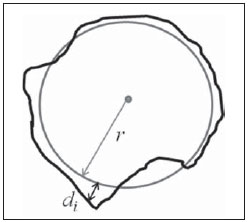 Figure 1. Example of a hypothetical circular area with a r radius (gray circle) equivalent to the lesion area (black outline). The radial distance between a point on the average circle and a pixel on the lesion contour outside the average circle is represented by di. The RA parameter is given by the mean value of di distances. 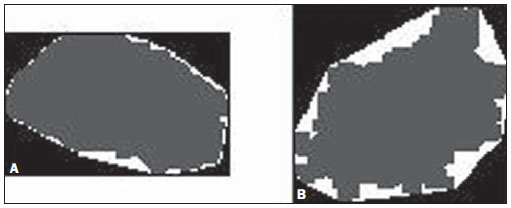 Figure 2. Example of regular (A) and irregular (B) lesion shapes (dark gray central area). The convex polygon is the most exterior outline (white) surrounding the segmented lesion perimeter. Note that there is a greater difference between the polygon perimeter and the irregular lesion. Based on the segmented lesions contour, five morphometric parameters were calculated: area ratio, circularity, depth-to-width ratio, overlap ratio, and normalized residual value, as defined below. Area ratio (RA) represents the mean distance between a medium circular contour and the pixels of the lesion contour out of the circular contour (Figure 1). Thus, the RA value increases proportionally to the number of pixels out of the circular region. It is expected that spiculated and lobular lesions tend to produce higher RA values than lesions with a regular contour(19). Circularity (C) is defined as the ratio between the square perimeter and the area of the segmented lesion. Typically utilized to reflect the contours complexity, C reaches its minimum value for circular contours, tending to increase for lesions with complex shapes(28). Depth-to-width ratio (DWR) is a specific parameter for analysis of breast lesions on US images. Benign lesions tend to be wider than deep in relation to the skin, producing lower DWR values, in contrast with malignant lesions that tend to be deeper(19). Overlap ratio (OR) and normalized residual value (nrv) are defined on the basis of a technique known as convex polygon, that is defined as a polygon inside which a lesion is circumscribed, where none of its interior angles is > 180º. As shown on Figure 2, the more irregular the contour, the greater the difference between the contour and respective convex polygon. Based on such a characteristic, the OR is defined as the ratio between the area of the segmented lesion and its respective convex polygon. Thus, identical contours correspond to identical convex polygon areas, and hence OR = 1. And for different contours, the convex polygon area will be always larger, OR < 1(19). In Figure 2, it is noticed that there is a residual area between the lesion contour and its respective convex polygon, so the more irregular is the lesion contour, the larger the residual area. Thus, nrv is defined as the ratio between the residual area and the convex polygon perimeter(19). Linear discriminant analysis The calculated morphometric parameters were submitted to a statistical method called linear discriminant analysis (LDA), in order to distinguish breast lesions according to the BI-RADS classification and to the histological diagnosis: either malignant or benign. In a simple way, LDA is utilized for data classification and dimensionality reduction, and is based on the maximization of the inter- and intraclass discrepancy, guaranteeing a maximum separation of data(32). Considering the limited number of cases, the authors have opted for analyzing the parameters performance with basis on the BI-RADS classification, dividing the lesions into two groups as follows: lesions classified as BI-RADS 2 and 3, and lesions classified as BI-RADS 4 and 5. Also, because of the limited number of cases, the leave-one-case out method was utilized(33) to give statistical validity to the analysis. The combined parameters performance was not studied. The hypothesis of nonexistence of statistical difference between groups BI-RADS 2 and 3 and BI-RADS 4 and 5 was evaluated with a t-test (α = 1%) between the mean values of the parameters for each group. The result of the LDA application to the parameters can be modeled as a random bivariate normal variable whose probability density functions (PDF) for the two hypothesis present a normal distribution(18). Such distributions may overlap, implying a compromise between false-positive and false-negative results, since a change in the decision making threshold affects the values for sensitivity and specificity in the test(18). The ROC (receiver operating characteristic) curve is a tool that relates sensitivity (S) and specificity (Sp) for each value of the possible decision making threshold. The area under the ROC curve (Az), a measurement usually employed, ranges from 0.5 (completely random behavior) to 1.0 (perfect discrimination). With such a definition, the most the curve approximates the left upper corner of the chart (higher S and lower 1 Sp), the best the diagnostic test performance(34). In the present study, the evaluation of parameters performance in the differentiation between malignant and benign lesions was based on the area Az under the ROC curve, as well as on the values for accuracy, specificity and sensitivity, regarding the operating point selected over the curve. It is important to highlight that the LDA, as well as the parameters calculation were implemented by means of software developed in Matlab language (Mathworks; Natick, USA). RESULTS The BI-RADS classification of lesions is presented on Table 1. It is observed that one invasive ductal carcinoma (Figure 3A) was classified as BI-RADS 3, and the hematoma (Figure 3B), as BI-RADS 4 (bolded figures on Table 1). 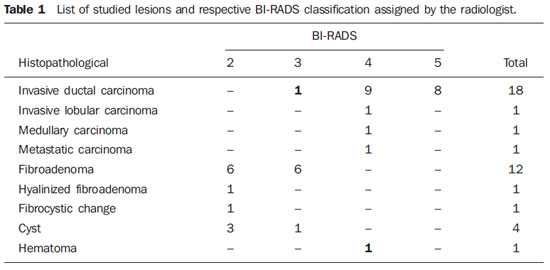 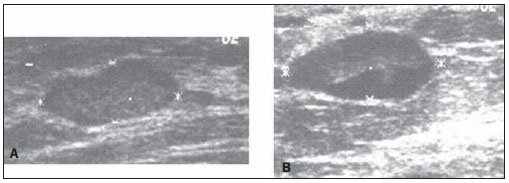 Figure 3. Sonographic image of invasive ductal carcinoma classified as BI-RADS 3 (A), and hematoma classified as BI-RADS 4 (B). Table 2 presents the mean values for the calculated parameters and respective standard deviations for each of the BI-RADS categories. As the parameters performance in the distinction among consecutive BI-RADS categories was evaluated, OR was the best, being capable of statistically differentiate between categories BI-RADS 3 and BI-RADS 4 (α = 5%; p = 0.015) and between categories BI-RADS 4 and BI-RADS 5 (α = 5%; p = 0.014). Besides OR, the DWR parameter has demonstrated to be capable of statistically differentiating between categories BI-RADS 3 and BI-RADS 4 (α = 1%; p = 0.006), while C could statistically differentiate between categories BI-RADS 4 and BI-RADS 5 (α = 5%; p = 0.011). 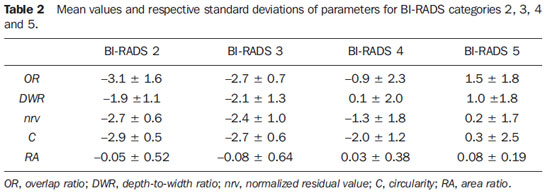 The mean values of morphometric parameters and respective standard deviations for lesion groups BI-RADS 2 and 3 and BI-RADS 4 and 5 are presented on Table 3. Assessing the p-values (α = 1%) for the t-test between mean values of morphometric parameters for groups BI-RADS 2 and 3 and BI-RADS 4 and 5, it is observed that only RA could not differentiate the two groups, while OR presented the greatest difference between the groups averages. 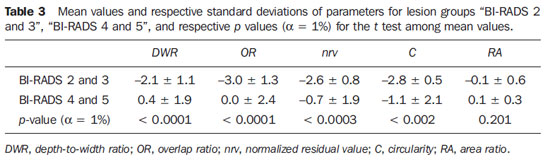 The PDF of the groups BI-RADS 2 and 3 and BI-RADS 4 and 5 for the OR parameter, as well as the OR values for each lesion, are shown on Figure 4. As the distribution of values for the different groups is analyzed, one observes that lesions classified as BI-RADS 2 (3.1 ± 1.6; asterisks on Figure 4) are highly concentrated, indicating reduced results dispersion. However, the OR value for the hyalinized fibroadenoma approximates 1.5 (largest circle on Figure 4), increasing the standard deviation for the group BI-RADS 2. Lesions classified as BI-RADS 3 (2.7 ± 0.7, smallest circles on Figure 4) present a subtle concentration at the right side of those classified as BI-RADS 2, but a little more scattered. Lesions classified as BI-RADS 4 (0.9 ± 2.3; diamonds on Figure 4) are more scattered, with three carcinomas (US images on Figure 5), and a medullary carcinoma clearly occupying the region of the group BI-RADS 2 and 3 (ellipse on Figure 4). Finally, lesions classified as BIRADS 5 (1.5 ± 1.8; squares on Figure 4), despite their OR mean values higher than the values for those classified as BI-RADS 4, overlap the latter because of the scattering observed for both groups. 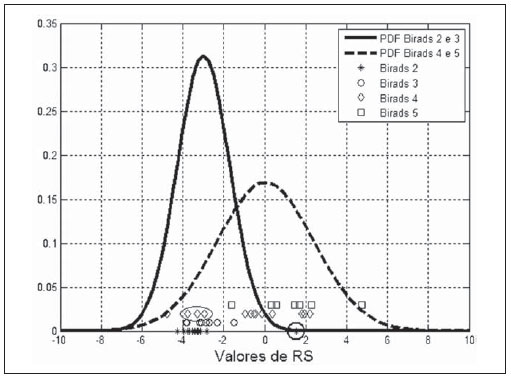 Figure 4. Density probability function of BI-RADS 2 and 3 and BI-RADS 4 and 5 groups for the OR parameter, as well as the OR values for each studied lesion. 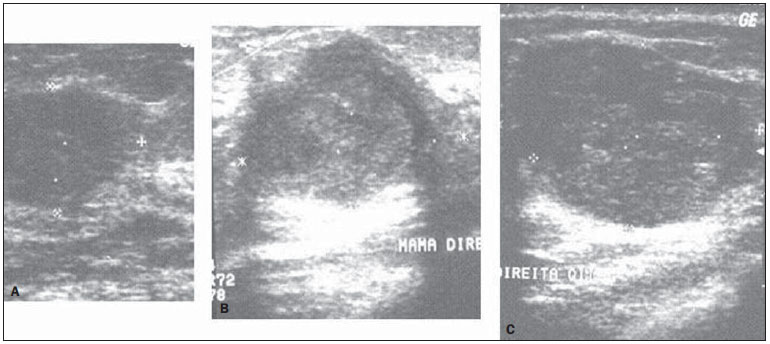 Figure 5. Sonographic images of the two invasive ductal carcinomas (A,B), and of the medullary carcinoma (C) classified as benign lesions by the OR parameter. These same lesions were correctly classified by RA and DWR. The result from the application of linear discriminant analysis to the parameters in the differentiation between benign and malignant lesions is presented on Table 4. Amongst the studied morphometric parameters, OR presented the best performance (Az = 0.86). Based on the OR parameter, four carcinomas were classified as benign lesions (S = 81.0%), while two fibroadenomas were classified as malignant lesions (Sp = 89.5%). It is important to note that one of the four carcinomas erroneously classified by the OR parameter is the invasive ductal carcinoma classified as BI-RADS 3 (Figure 3A; bolded figures on Table 1). The other three carcinomas classified as benign by the OR parameter are shown on Figure 5. The PDF of both benign and malignant lesions for OR, as well as their values for each studied lesion, are shown on Figure 6. 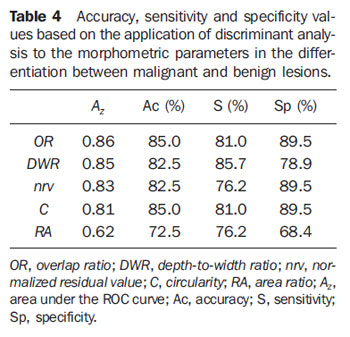 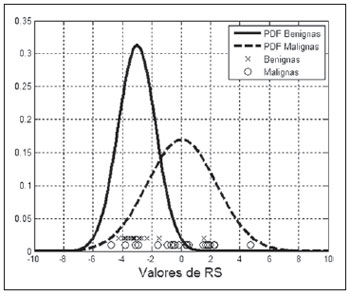 Figure 6. Density probability function of benign and malignant lesions for the OR parameter, as well as OR values for each studied lesion. The DWR parameter presented the second best performance (Az = 0.85), with three carcinomas (US images on Figures 3A, 7A and 7B) classified as benign lesions (S = 85.7%); and three fibroadenomas (two examples on Figures 7C and 7D), and one cyst classified as malignant lesions (Sp = 78.9%). 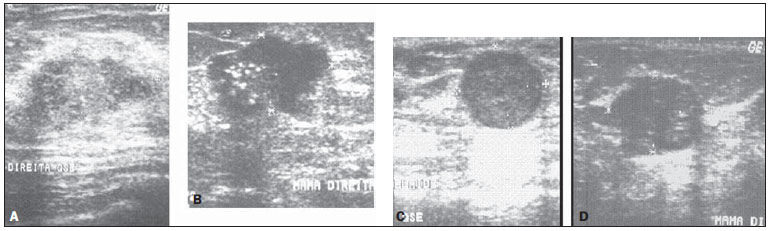 Figure 7. Sonographic images of two invasive ductal carcinomas (A,B) classified as benign lesions by DWR. These same lesions were correctly classified by the OR parameter. Sonographic images of two of the fibroadenomas (C,D) classified as malignant lesions by DWR. These same lesions were correctly classified by the OR parameter. The C parameter, despite the lower value for Az (0.81) as compared with the OR, demonstrated accuracy, sensitivity and specificity equivalent to ones of the best parameter. Figure 8, with ROC curves of the parameters with Az values > 0.80, demonstrates that, despite its smaller area, the C parameter presents a coincidental operating point with the OR curve (arrow on Figure 8). 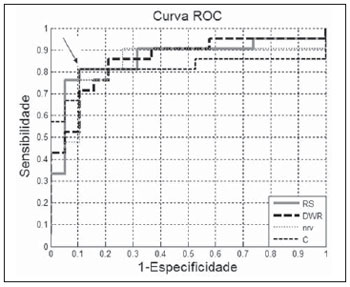 Figure 8. ROC curves of parameters with Az values > 0.80. The arrow indicates the coincidental operating point between the OR and C ROC curves. The lowest value for specificity (76.2%) resulted from the nrv and RA parameters, which classified five carcinomas as benign lesions. However, nrv presented higher specificity (89.5%) than RA (68.4%), considering that only two fibroadenomas were classified as malignant lesions by nrv, as compared with five fibroadenomas and one cyst equivocally classified by RA. Finally, the worst performance was presented by the RA, with values < 80% for accuracy (72.5%), sensitivity (76.2%) and specificity (68.4%). DISCUSSION Ultrasonography has demonstrated to play a relevant role as an adjuvant to mammography in the diagnosis of breast cancer, and the BI-RADS lexicon has aided in the consolidation of such a role(35). The main objective of the BI-RADS lexicon for US is to standardize the assessment and reporting of breast lesions identified on US images, which tends to facilitate the sonographic finding follow-up through the comparison with subsequent reports. However, despite the standardization allowed by the BI-RADS, the sonographic examination as well as the respective reporting is still an operator-dependent task. Additionally, reports in the literature demonstrate that, as the BI-RADS lexicon for US is adopted, moderate to substantial levels of agreement have been found in inter- and intraobserver studies(11,12,1417). In the present study, five morphometric parameters were calculated and their performances were evaluated in the differentiation of breast lesions classified as BI-RADS 2, 3, 4 and 5 at US, with basis on the results of respective histopathological reports. Amongst the five studied parameters, four of them could statistically differentiate the groups BI-RADS 2 and 3 and BI-RADS 4 and 5. The RA parameter was the sole exception, and, amongst the other four parameter, OR presented the greatest difference between its mean values for the two groups. According to the literature, a significant interobserver variability may be observed in the classification between BI-RADS categories 3 and 4(17). The excessive classification of BI-RADS 3 lesions as BI-RADS 4 would lead to a decrease in the biopsies specificity and to an increase in the number of unnecessary invasive procedures. On the other hand, the excessive classification of BI-RADS 4 lesions as BI-RADS 3 would lead to late diagnosis of a certain number of malignant lesions. In the present study, BI-RADS categories 3 and 4 were differentiated by the OR and DWR parameters, suggesting that such parameters might be useful to distinguish between lesions in these two categories. Also, OR and DWR were the morphometric parameters with best performance in the differentiation between benign and malignant lesions (Table 4). Amongst the four carcinomas classified as benitypical of fibrgn lesions by OR, one presented characteristics oadenomas (Figure 3A), and was also classified as BI-RADS 3. The other three carcinomas presented heterogeneous echotexture and lobulated contour at US (Figure 5). Such a finding indicates that OR is not the better parameter to quantify irregularities and lobulations of a lesion contour. Despite its underperformance (Table 4), the RA parameter could quantify such characteristics, correctly classifying these lesions. The DWR parameter presented the second best performance in terms of Az, correctly identifying three of the four carcinomas equivocally classified as benign lesions by the OR parameter (Figure 5), as well as the two benign lesions (one fibroadenoma and the hyalinized fibroadenoma) classified as malignant lesions by the OR parameter. On the other hand, other three malignant lesions (carcinomas) were equivocally classified as benign lesions by the DWR parameter, one of them being the lesion classified as BI-RADS 3 by the radiologist and as benign by the OR parameter (Figure 3A). The other two malignant lesions presented echographic characteristics corresponding to BI-RADS 4 and 5, but, because of their horizontal orientation, the DWR parameter classified them as benign lesions (Figure 7). It is important to note that these same two lesions were correctly classified by the OR parameter. The four benign lesions classified as malignant by DWR presented echographic characteristics corresponding to benign lesions. However, the quantitative analysis of the DWR parameter indicates a subtle verticalization of the lesions, according examples shown on Figures 7C and 7D. Nevertheless, in a complementary role, the OR parameter correctly classify these four lesions. The C parameter, despite its lower Az value, presented a performance equivalent to OR in terms of accuracy, sensitivity and specificity. Additionally, C was the only parameter that has classified as malignant lesion, the carcinoma indicated as BI-RADS 3 (Figure 3A). It is important to highlight that the literature indicates C as a relevant parameter in the differentiation between malignant and benign lesions(19,35). Finally, the hematoma classified as BI-RADS 4 was correctly classified as benign by all the studied parameters. The analysis of the OR and DWR parameters performance suggests that a combination of different parameters might add relevant information to the quantification of morphometric characteristics of lesions, improving the performance achieved with individual parameters. Additionally, it corroborates the results reported by other studies demonstrating that irregularity in lesion contour, as well as the depth-to-width ratio constitute relevant characteristics in the differentiation between malignant and benign lesions at US images(22,23,27) and can be quantified by morphometric parameters. CONCLUSION Amongst the studied morphometric parameters, OR could statistically differentiate BI-RADS categories 3 and 4 and BI-RADS 4 and 5, suggesting that the evaluation of morphometric parameters calculated on the basis of breast lesions contour at US may be useful in the differentiation of BI-RADS categories. Additionally, the OR parameter presented the best performance in the differentiation between malignant and benign lesions. Such results demonstrate the potentiality of the morphometric analysis to aid in the distinction of patients who should be submitted to invasive procedures from those who otherwise could safely be followed-up with imaging methods, reducing both financial and emotional burdens in specific cases. It is important to highlight that considering the present casuistry limitation, a further and more comprehensive study is planned by the authors. As a future proposal, the authors suggest an analysis of the present parameters in combination with others, such as texture, besides a higher number of images for an appropriate evaluation of the correlation between quantitative parameters extracted from sonographic images of breast lesions and their respective BI-RADS categories. REFERENCES 1. Rodrigues MCS, Calas MJG, Nadruz E. Mamografia: exame único, tecnologias diversas. Femina. 2008;36:3737. 2. Humphrey LL, Helfand M, Chan BK, et al. Breast cancer screening: a summary of the evidence for the U.S. Preventive Services Task Force. Ann Intern Med. 2002;137(5 part 1):34760. 3. Calas MJG, Koch HA, Dutra MVP. Uma proposta de classificação ecográfica mamária. RBGO. 2005;27:51523. 4. Calas MJG, Koch HA, Dutra MVP. Ultra-sonografia mamária: avaliação dos critérios ecográficos na diferenciação das lesões mamárias. Radiol Bras. 2007;40:17. 5. Paulinelli RR, Calas MJG, Freitas Junior R. BIRADS e ultra-sonografia mamária uma análise crítica. Femina. 2007;35:56572. 6. Arger PH, Sehgal CM, Conant EF, et al. Interreader variability and predictive value of US descriptions of solid breast masses: pilot study. Acad Radiol. 2001;8:33542. 7. Baker JA, Kornguth PJ, Soo MS, et al. Sonography of solid breast lesions: observer variability of lesion description and assessment. AJR Am J Roentgenol. 1999;172:16215. 8. Stavros AT, Thickman D, Rapp CL, et al. Solid breast nodules: use of sonography to distinguish between benign and malignant lesions. Radiology. 1995;196:12334. 9. Paulinelli RR, Freitas-Júnior R, Moreira MAR, et al. Risk of malignancy in solid breast nodules according to their sonographic features. J Ultrasound Med. 2005;24:63541. 10. Berg WA, Blume JD, Cormack JB, et al. Operator dependence of physician-performed whole-breast US: lesion detection and characterization. Radiology. 2006;241:35565. 11. Costantini M, Belli P, Ierardi C, et al. Solid breast mass characterisation: use of the sonographic BI-RADS classification. Radiol Med. 2007;112:87794. 12. Del Frate C, Bestagno A, Cerniato R, et al. Sonographic criteria for differentiation of benign and malignant solid breast lesions: size is of value. Radiol Med. 2006;111:78396. 13. Hong AS, Rosen EL, Soo MS, et al. BI-RADS for sonography: positive and negative predictive values of sonographic features. AJR Am J Roentgenol. 2005;184:12605. 14. Calas MJG, Almeida RMVR, Gutfilen B. et al. Intraobserver interpretation of breast ultrasonography following the BI-RADS classification. Eur J Radiol. 2010;74:5258. 15. Lazarus E, Mainiero MB, Schepps B, et al. BI-RADS lexicon for US and mammography: interobserver variability and positive predictive value. Radiology. 2006;239:38591. 16. Lee HJ, Kim EK, Kim MJ, et al. Observer variability of Breast Imaging Reporting and Data System (BI-RADS) for breast ultrasound. Eur J Radiol. 2008;65:2938. 17. Levy L, Suissa M, Chiche JF, et al. BIRADS ultrasonography. Eur J Radiol. 2007;61:20211. 18. Azevedo-Marques PM. Diagnóstico auxiliado por computador na radiologia. Radiol Bras. 2001;34:28593. 19. Alvarenga AV, Infantosi AFC, Pereira WCA, et al. Assessing the performance of morphological parameters in distinguishing breast tumors on ultrasound images. Med Eng Phys. 2010;32:4956. 20. Gómez W, Leija L, Alvarenga AV, et al. Computerized lesion segmentation of breast ultrasound based on marker-controlled watershed transformation. Med Phys. 2010;37:8295. 21. Chen CM, Chou YH, Han KC, et al. Breast lesions on sonograms: computer-aided diagnosis with nearly setting-independent features and artificial neural networks. Radiology. 2003;226:50414. 22. Drukker K, Giger ML, Horsch K, et al. Computerized lesion detection on breast ultrasound. Med Phys. 2002;29:143846. 23. Horsch K, Giger ML, Venta LA, et al. Computerized diagnosis of breast lesions on ultrasound. Med Phys. 2002;29:15764. 24. Huang YL, Chen DR. Watershed segmentation for breast tumor in 2-D sonography. Ultrasound Med Biol. 2004;30:62532. 25. Huber S, Danes J, Zuna I, et al. Relevance of sonographic B-mode criteria and computer-aided ultrasonic tissue characterization in differential/diagnosis of solid breast masses. Ultrasound Med Biol. 2000;26:124352. 26. Karssemeijer N, Otten JD, Verbeek AL, et al. Computer-aided detection versus independent double reading of masses on mammograms. Radiology. 2003;227:192200. 27. Lefebvre F, Meunier M, Thibault F, et al. Computerized ultrasound B-scan characterization of breast nodules. Ultrasound Med Biol. 2000;26:14218. 28. Castleman KR. Digital image processing. Englewood Cliffs, NJ: Prentice-Hall; 1996. 29. Olabarriaga SD, Smeulders AWM. Interaction in the segmentation of medical images: a survey. Med Image Anal. 2001;5:12742. 30. Szabo TL. Diagnostic ultrasound imaging: inside out. Amsterdam: Elsevier; 2004. 31. American College of Radiology. BI-RADS: Ultrasound. In: Breast Imaging Reporting and Data System. BI-RADS Atlas. 4th ed. Reston, VA: American College of Radiology; 2003. 32. Johnson RA, Wichern DW. Applied multivariate statistical analysis. 4th ed. Upper Saddle River, NJ: Prentice-Hall; 1998. 33. Bishop CM. Neural networks for pattern recognition. Oxford: Clarendon Press; 1995. 34. Metz CE. ROC methodology in radiologic imaging. Invest Radiol. 1986;21:72033. 35. Chou YH, Tiu CM, Hung GS, et al. Stepwise logistic regression analysis of tumor contour features for breast ultrasound diagnosis. Ultrasound Med Biol. 2001;27:14938. 1. Master, Fellow PhD degree, Department of Radiology, School of Medicine, Universidade Federal do Rio de Janeiro (UFRJ), Rio de Janeiro, RJ, Brazil. 2. Researcher/Technologist, Laboratório de Ultrassom (Labus), Division of Acoustic Metrology and Vibrations (Diavi), Board of Scientific and Industrial Metrology (Dimci), Instituto Nacional de Metrologia, Qualidade e Tecnologia (Inmetro), Rio de Janeiro, RJ, Brazil. 3. PhD, Associate Professor, Department of Radiology, Coordinator for the Program of Post-graduation in Medicine (Radiology) at Universidade Federal do Rio de Janeiro (UFRJ), Rio de Janeiro, RJ, Brazil. 4. PhD, Associate Professor, Program of Biomedical Engineering, COPPE/UFRJ Instituto Alberto Luiz Coimbra de Pós-Graduação e Pesquisa de Engenharia, Rio de Janeiro, RJ, Brazil. Mailing Address: Dr. André Victor Alvarenga / Dra. Maria Julia Gregorio Calas Programa de Engenharia Biomédica - Centro de Tecnologia Bloco H, Sala 327, Cidade Universitária, Ilha do Fundão. Caixa Postal: 68510 Rio de Janeiro, RJ, 21945-970, Brazil E-mail: avalvarenga@inmetro.gov.br / mjgcalas@terra.com.br Received June 29, 2011. Accepted after revision August 25, 2011. Financial support: Coordenação de Aperfeiçoamento de Pessoal de Nível Superior (Capes) and Conselho Nacional de Desenvolvimento Científico e Tecnológico (CNPq). Study developed at COPPE/UFRJ Instituto Alberto Luiz Coimbra de Pós-Graduação e Pesquisa de Engenharia, Program of Biomedical Engineering, Rio de Janeiro, RJ, Brazil. |
|
Av. Paulista, 37 - 7° andar - Conj. 71 - CEP 01311-902 - São Paulo - SP - Brazil - Phone: (11) 3372-4544 - Fax: (11) 3372-4554