Radiologia Brasileira - Publicação Científica Oficial do Colégio Brasileiro de Radiologia
AMB - Associação Médica Brasileira CNA - Comissão Nacional de Acreditação
 Vol. 44 nº 2 - Mar. / Apr. of 2011
|
ICONOGRAPHIC ESSAY
|
|
Signs in neuroradiology Part 1 |
|
|
Autho(rs): Fabrício Guimarães Gonçalves1; Filipe Ramos Barra2; Valter de Lima Matos3; Cássio Lemos Jovem2; Lázaro Luís Faria do Amaral4; Raquel delCarpio-ODonovan5 |
|
|
Keywords: Radiological signs; Neuroradiology; Computed tomography; Magnetic resonance imaging. |
|
|
Abstract: INTRODUCTION
Descriptive terms in radiology are usually based on standards and consensus. There are cases, however, in which the radiologist utilizes metaphors in the form of signs in allusion to foods, animals or objects, to support his hypothesis for a given problem and describe the findings of a particular disease. Signs, when present, are important as they allude to a more specific diagnosis, and contribute with a certain degree of confidence in the diagnosis. In general, we recognize what we already know, and tools that aid in the interpretation of images are valuable. In this first part, the authors discuss 15 neurological signs, with illustrative images for each one of them. Ice-cream cone sign of the temporal bone The temporal bone ice-cream cone sign represents the normal appearance of the malleoincudal joint on computed tomography (CT). The malleus (hammerhead) represents the ice-cream ball, and the body of the incus (anvil) represents cone (Figure 1). The anatomic identification of such structures is important, particularly in cases of trauma in which ossicular luxation may occur. 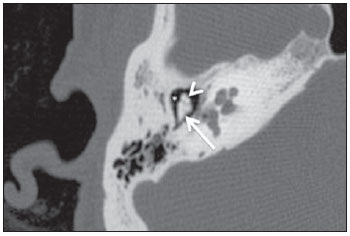 Figure 1. High resolution, axial CT image demonstrating the ice-cream sign of the temporal bone. The sign represents the typical appearance of the malleoincudal joint. The malleus represents the icecream ball (arrow head) and the body of the incus, the cone (arrow). The lateral epitympanic space (Prussaks space) is located laterally to the malleus and incus (asterisk). Cord sign in cerebral venous thrombosis Cerebral venous thrombosis (CVT) is a rare entity, with variable clinical presentations. Seventy-five percent of the CVT occur in young women, between 20 and 40 years of age, with the superior sagittal sinus (SSS) being most frequently affected (62% of cases). Such increased incidence can be explained by pregnancy, puberty and use of oral contraceptives(1). The diagnosis can be achieved by means of CT (the most readily available), magnetic resonance imaging (MRI) (the method of choice) or by conventional angiography (CA) (the most invasive method). In 20% of cases, CT scans are normal. CVT findings can be classified in direct and indirect. The cord sign and the empty delta sign are direct signs of CVT. Indirect signs include: edema, infarction and hemorrhage. The cord sign is characterized as increased density of the sinuses or of the cortical or deep veins (Figure 2), originated from the thrombosed material inside the affected vessel. The cord sign is most frequently identified within two weeks after the first symptoms onset. With time, the thrombus becomes isodense and subsequently, hypodense(2). 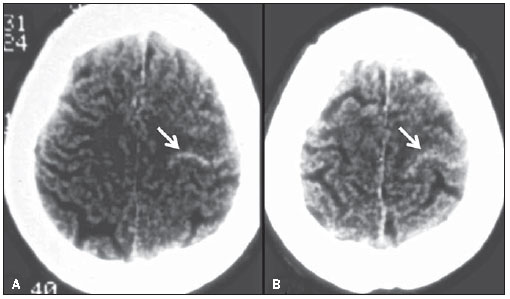 Figure 2. Axial images of a plain CT scan of the brain (A,B) of a female patient with a history of headache for the last seven days, and chronic use of oral contraceptive. The curvilinear hyperdensity at the site of a superficial frontal vein on the left side (arrows) represents the cord sign and confirms de clinical hypothesis of cerebral venous thrombosis. Empty delta sign in venous sinuses thrombosis The empty delta sign may occur in cases of CVT, characteristically involving the SSS. On contrast-enhanced CT/MRI, the sign is characterized by a non-enhancing central triangular shaped area (the thrombus itself), limited by enhancing dura mater (Figure 3)(3). Numerous factors may lead to CVT, as follows: inflammatory processes, infection, fibrosis of the venous sinuses walls, direct tumoral compression or/and extension, and hypercoagulable states(4). The empty delta sign is usually not identified at the first week (the material is isodense) as well as in chronic cases (more than two months), due to thrombus recanalization( 5). 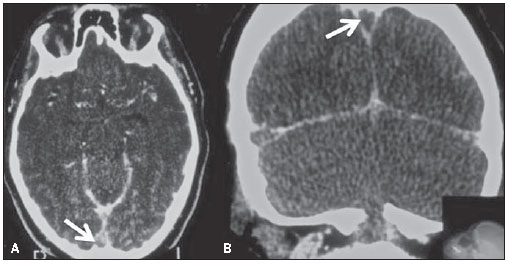 Figure 3. Axial (A) and coronal (B) contrast enhanced CT images of 24-year-old female patient on contraceptive use, with history of headache over the past ten days. Note a triangular rim of enhancement (dura mater) in the superior sagittal sinus, delimitating a non-enhancing central area (arrows). Such finding represents the empty delta sign which is characteristic of dural venous sinuses thrombosis. Arrow sign in ruptured middle cerebral artery aneurysm In ruptured aneurysms the pattern of distribution of subarachnoid hemorrhage can indicate its most likely location. In cases of bifurcation middle cerebral artery (MCA) aneurismal rupture the bleed may present the shape of an arrow, with the shaft and the tip representing blood in the horizontal segment of the Sylvian fissure and in the frontotemporal opercular area, respectively (Figure 4)(6). 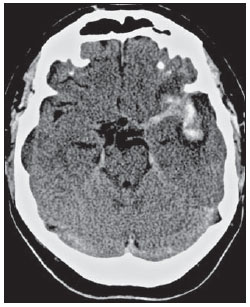 Figure 4. Axial image from a non-enhanced CT scan of the brain of a 45-year-old male patient with history of intense headache. Moderate subarachnoid hemorrhage is observed adjacent to the left middle cerebral artery bifurcation, with accumulation of blood in the Sylvian fissure. The typical arrow sign is formed by subarachnoid hemorrhage between the insula and the frontotemporal opercular area and along the M1 segment of the middle cerebral artery. Dense artery sign in acute middle cerebral artery infarction The dense MCA sign is one of the early signs of infarct. This is due an increase in density of its proximal segments, secondary to thrombosis (Figure 5). False-positive results may occur, particularly in cases of parietal calcification. It is important to observe that the distal branches of the MCAs rarely present parietal calcifications. Focal subarachnoid hemorrhage may simulate an abnormally dense MCA especially when located at the Sylvian fissure and constitute an additional cause for false-positive results(7). 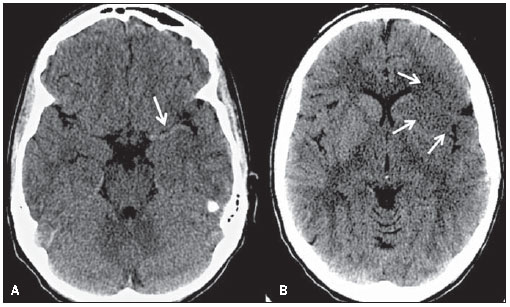 Figure 5. Axial images from a non-enhanced CT scan of the brain of a 24-year-old female patient with history of cocaine abuse. On A, increased density is observed at the M1 segment of the left middle cerebral artery, corresponding to thrombosis (arrow). Such finding is one of the early signs of brain infarction. On B, hypodensity is noted, with loss of differentiation between white and grey matter in the insular, opercular and basal ganglia regions (arrow), characterizing an acute infarction. Dot sign in acute middle cerebral artery infarction The dot sign is one of the early signs of acute infarction and corresponds to a punctate hyperdensity in the Sylvian fissure. The signal represents thrombosis in the M2 and M3 segments of the MCA on plain CT scans. The presence of a thrombus/clot within the vessel alters and increases its density (Figure 6). The dot sign has a high specificity and high positive predictive value, but has low sensitivity(8). 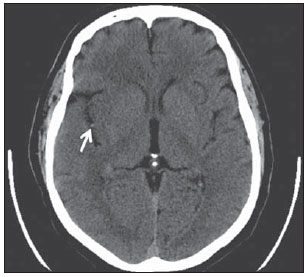 Figure 6. Axial image from a non-enhanced CT scan of the brain of a 55- year-old patient with a history of left hemiplegia. The finding of punctate hyperdensity at the M2 segment of the right middle cerebral artery (arrow) is also known as the dot sign. This is one of the earliest signs of acute cerebral infarction and represents the presence of a thrombus/clot within the vessel. Hot nose sign at brain death The hot nose sign can be seen in cases of brain death and it is defined by the presence of early and increased radiotracer activity in the nasopharyngeal region. It may also be seen as an intense blush (hyperemia) at CA examinations (Figure 7). The phenomenon is a result of a reduced blood flow in the internal carotid artery and increased flow in the external carotid branches. Such signal is not exclusive of brain death and may be found in different situations that lead to intracranial flow reduction in one or both internal carotid arteries( 9). 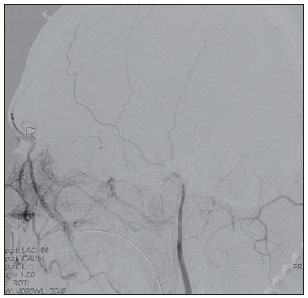 Figure 7. Digital subtraction angiography of a 52-year-old male patient clinically diagnosed with brain death. The absence of opacification in the intracranial segments of the internal carotid arteries associated with increased flow in the external carotid arteries branches particularly in the nasopharyngeal region, characterizes the hot nose sign. Tau (t) sign in persistent trigeminal artery The sign of the Greek letter t occurs in cases of persistent trigeminal artery (PTA) and can be identified at CA, CT angiography and MR angiography. PTA is the most prevalent type of carotid-basilar anastomosis and it is formed by the horizontal and vertical segments of the internal carotid artery (Figure 8). Despite being an incidental finding in the majority of the cases, PTA is usually associated with basilar artery hypoplasia and can be accompanied by oculomotor nerve palsy, trigeminal neuralgia or, eventually, with the presence of aneurysms( 10). 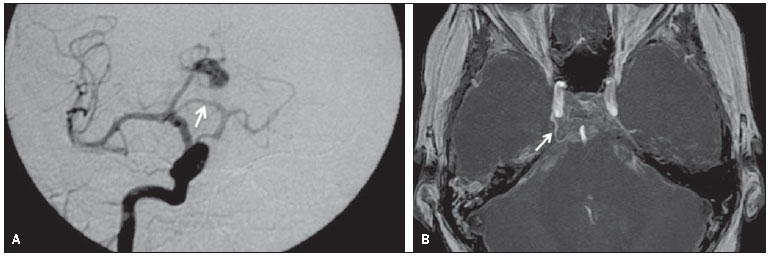 Figure 8. Digital angiography of a 45-year-old female patient (A) with carotid-basilar anastomosis, through a persistent trigeminal artery (arrow), also known as the tau (τ) sign. The same finding is noted in another female patient (B), on a MIP MR angiography image (arrow). Caput medusae sign in developmental venous anomaly The caput medusae sign is indicative of developmental venous anomaly (DVA), and is identifiable at CA, CT and MRI. DVAs correspond to a network of dilated, abnormal medullary veins with radial distribution, converging into a dominant, calibrous transparenchymal vein, which may drain into a cortical vein, dural sinuses or into the deep venous system (Figure 9). DVAs are the most frequent intracranial vascular abnormalities, which are associated with cavernomas in around 30% of cases. Despite being considered incidental findings, in some cases these may lead to intracranial hemorrhage, thrombosis and venous infarction(11). Hemorrhages secondary to DVA are rarely found, with an annual risk of 0.7%(12). 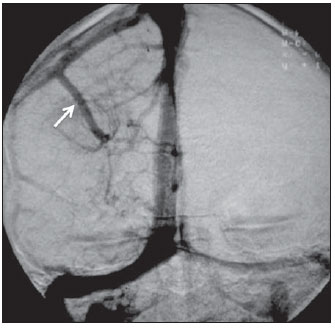 Figure 9. Incidental developmental venous anomaly found in a digital subtraction angiography of a 40-year-old female patient. The pattern of a radial network of dilated, abnormal medullary veins converging into a dominant calibrous transparenchymal vein, which then courses into a cortical vein and subsequently into the superior dural sinus (arrow) characterizes the caput medusae sign. DVAs are usually incidental findings but must be associated with cavernomas, intracranial hemorrhage, thrombosis and venous infarction. Spoke wheel sign in meningioma The spoke wheel sign refers to the typical angiographic appearance found in meningiomas. This sign corresponds to multiple small arteries radially distributed from a dominant feeding artery (Figure 10). Meningiomas are the most common primary intracranial tumors in adults. They are extra-axial, slow-growing, well-vascularized lesions with a benign behavior (grade I, according to the World Health Organization). Another remarkable and very common characteristic of meningiomas is the presence of a dural tail and, in 25% of cases, hyperostosis of the adjacent bone(13). 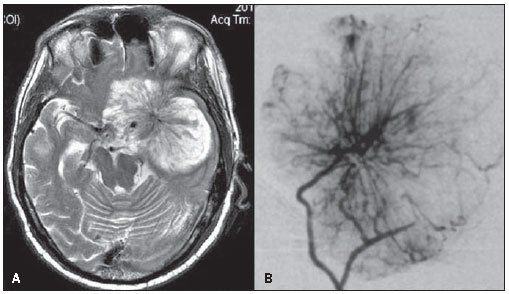 Figure 10. Two female patients with meningioma. Note the characteristic spoke wheel sign in both patients, formed by multiple small arteries radially distributed from a dominant feeding artery. On A, axial T2-weighted image of a 60-year-old patient with a greater sphenoid wing meningioma, and on B, digital subtraction angiography of a 55-year-old female patient with a meningioma in the right temporal region. Onion skin sign in Balós concentric sclerosis The onion skin sign is considered pathognomonic for Balós concentric sclerosis( 14). According to the first reports on such disorder, most patients had an unfavorable history with progression either to death or disability. Recent cases however, have presented a less dramatic course. Balós concentric sclerosis may occur as an isolated phenomenon or precede the development of multiple sclerosis. The lesions present a peculiar pattern of concentric lamellae of demyelination alternated with lamellae of myelinating or remyelinating white matter. Such lesions are most frequently found in the frontal lobes, but may be seen in the whole neuroaxis(14). Magnetic resonance imaging (MRI) is the best method for the disease diagnosis and follow- up. In spite of the high sensitivity of T2-weighted images to demonstrate demyelinating lesions, the concentric rings are better identified on T1-weighted images (Figure 11). The enhancement following contrast administration is variable and probably represents active areas of demyelination( 15). 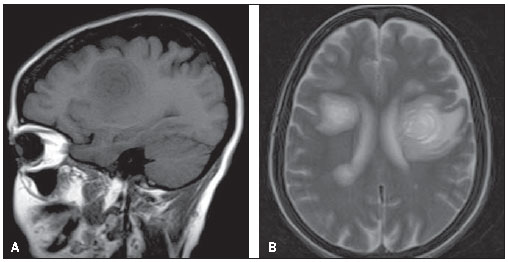 Figure 11. Sagittal T1 (A) and axial T2-weighted images (B) of a female 50-year-old patient with history of progressive weakness particularly on the right side, with sensory aphasia and dysphagia. Concentric rings are observed in the frontal lobes, particularly on the left side. Such lamellar appearance (onion skin sign) is virtually pathognomonic of Balós concentric sclerosis. This case is a courtesy by Doctor Silvana Alves (Brasília, DF, Brazil). Eccentric target sign in toxoplasmosis The eccentric or asymmetrical target sign is highly suggestive of central nervous system toxoplasmosis. The sign represents a ring enhancing abscess associated with an enhancing mural nodule (Figure 12). This finding is highly specific, but has low sensitivity, being found in approximately 30% of cases. The pathological correlation of such sign is not completely understood, but it is believed to represent internal folds and invaginations of the abscess walls(16). 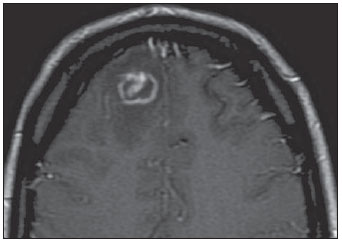 Figure 12. Axial enhanced T1 image of a 35-year-old female patient with acquired immune deficiency syndrome, encephalopathy and decreased level of consciousness. An eccentric enhancing mural nodule is seen in a ring-enhancing lesion characterizes the eccentric or asymmetric target sign. Reversal sign in diffuse cerebral anoxia Such sign is characterized by the relative inversion of attenuation between the supra and infratentorial structures on unenhanced CT and may indicate diffuse brain ischemia. The sign can explained by relative increase in the density of the cerebellum, basal ganglia and thalami, and decreased density of the cerebral cortex and white matter (Figure 13). Reversal sign can occur secondary to head trauma, hypoxia, birth anoxia, near drowning, status epilepticus, hypothermia, bacterial meningitis and strangulation. The pathogenesis is not completely clarified(17). 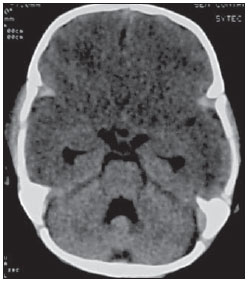 Figure 13. Unenhanced axial CT image of an 18- month-old patient with a history of near drowning. Inversion of attenuation is observed between the supra and infratentorial structures with a relative increase in the density of the cerebellum and decreased density of the cerebral cortex and white matter. Such finding is known as reversal sign, characteristic of diffuse cerebral anoxia. Dawsons fingers in multiple sclerosis The Dawsons fingers in multiple sclerosis are related to white matter inflammatory changes that occur around the perimedullary veins. These are ovoid lesions, with the longest axis perpendicular to the corpus callosum (Figure 14). James Walker Dawson was Scottish pathologist who developed relevant studies on multiple sclerosis. The demyelinating plaques are commonly located in the juxtacortical and periventricular white matter, in the corpus callosum and callosal-septal interface, with high signal intensity on sequences with long repetition time and hypo to iso-signal intensity on T1-weighted images(18). 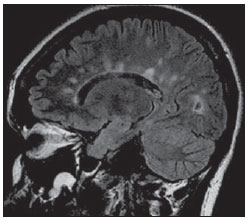 Figure 14. Sagittal FLAIR image of a 39-year-old female patient with clinical diagnosis of multiple sclerosis. Multiple, ovoid hyperintense periventricular lesions are observed at the callosal-septal interface, with the largest axis perpendicular to the corpus callosum. Such finding is known as Dawsons fingers and is related to perivenular demyelination found in multiple sclerosis. Mount Fuji sign in hypertensive pneumocephalus This sign is seen in bilateral subdural hypertensive pneumocephalus. These air collections cause compression of the frontal lobes, which take up a shape similar to the Mount Fuji silhouette (Figure 15). Hypertensive pneumocephalus is a neurosurgical emergency, in which the increased air pressure is thought to be secondary to a check-valve mechanism. Air would enter freely into the subdural space by a defect in the bone but would not scape with obstructive and the egress of air being blocked by an obstruction. This sign is useful in the differentiation between hypertensive and non-hypertensive pneumocephalus. Hypertensive pneumocephalus may after the drainage of subdural hematomas, following skull base, paranasal sinuses and posterior fossa surgeries and in cases of head trauma(19). 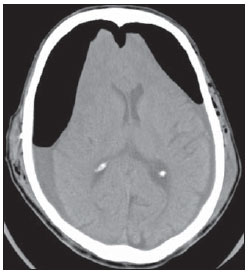 Figure 15. Axial CT image of a 63-year-old patient with a history of traumatic brain injury and bilateral subdural hematomas drainage. Bilateral frontal subdural pneumocephalus are observed, causing compression over the frontal lobes. Such imaging finding is known as Mount Fuji sign, as an allusion to the Japanese mountain. CONCLUSION The aforementioned signs are important tools as they lead to a more specific diagnosis and add a certain degree of confidence in the diagnosis. With such information, the assisting physician can better establish the correlation between imaging and clinical findings. REFERENCES 1. Filippidis A, Kapsalaki E, Patramani G, et al. Cerebral venous sinus thrombosis: review of the demographics, pathophysiology, current diagnosis, and treatment. Neurosurg Focus. 2009;27:E3. 2. Vyas S, Singh P, Rahul K, et al. Cord sign in deep cerebral venous thrombosis. J Emerg Med. 2009. [Epub ahead of print]. 3. Virapongse C, Cazenave C, Quisling R, et al. The empty delta sign: frequency and significance in 76 cases of dural sinus thrombosis. Radiology. 1987;162:77985. 4. Provenzale JM, Joseph GJ, Barboriak DP. Dural sinus thrombosis: findings on CT and MR imaging and diagnostic pitfalls. AJR Am J Roentgenol. 1998;170:77783. 5. Lee EJ. The empty delta sign. Radiology. 2002; 224:7889. 6. Maramattom BV, Wijdicks EF. Arrow sign in MCA trifurcation aneurysm. Neurology. 2004;63: 1323. 7. Morita S, Ueno E, Masukawa A, et al. Hyperattenuating signs at unenhanced CT indicating acute vascular disease. Radiographics. 2010;30:111 25. 8. Barber PA, Demchuk AM, Hudon ME, et al. Hyperdense sylvian fissure MCA dot sign: a CT marker of acute ischemia. Stroke. 2001;32:848. 9. Orrison WW Jr, Champlin AM, Kesterson OL, et al. MR hot nose sign and intravascular enhancement sign in brain death. AJNR Am J Neuroradiol. 1994;15:9136. 10. Kalidindi RS, Balen F, Hassan A, et al. Persistent trigeminal artery presenting as intermittent isolated sixth nerve palsy. Clin Radiol. 2005;60: 5159. 11. Truwit CL. Venous angioma of the brain: history, significance, and imaging findings. AJR Am J Roentgenol. 1992;159:1299307. 12. Garner TB, Del Curling O Jr, Kelly DL Jr, et al. The natural history of intracranial venous angiomas. J Neurosurg. 1991;75:71522. 13. Campbell BA, Jhamb A, Maguire JA, et al. Meningiomas in 2009: controversies and future challenges. Am J Clin Oncol. 2009;32:7385. 14. Caracciolo JT, Murtagh RD, Rojiani AM, et al. Pathognomonic MR imaging findings in Balo concentric sclerosis. AJNR Am J Neuroradiol. 2001;22:2923. 15. Simon JH, Kleinschmidt-DeMasters BK. Variants of multiple sclerosis. Neuroimaging Clin N Am. 2008;18:70316, xi. 16. Fischbein NJ, Dillon WP, Barkovich AJ. Teaching atlas of brain imaging. New York, NY: Thieme; 1999. 17. Han BK, Towbin RB, De Courten-Myers G, et al. Reversal sign on CT: effect of anoxic/ischemic cerebral injury in children. AJR Am J Roentgenol. 1990;154:3618. 18. Traboulsee AL, Li DK. The role of MRI in the diagnosis of multiple sclerosis. Adv Neurol. 2006; 98:12546. 19. Sadeghian H. Mount Fuji sign in tension pneumocephalus. Arch Neurol. 2000;57:1366. 1. Titular Member of Colégio Brasileiro de Radiologia e Diagnóstico por Imagem (CBR), Clinical Fellow in Neuroradiology at the Montreal General Hospital, McGill University Health Centre (MUHC), Montreal, Quebec, Canada. 2. MDs, Residents in Radiology and Imaging Diagnosis at the Hospital Universitário de Brasília, Brasília, DF, Brazil. 3. MD, Neuroradiologist at the Hospital Universitário de Brasília and Hospital Santa Luzia, Brasília, DF, Brazil. 4. MD, Neuroradiologist, Head of the Department of Neuroradiology at Medimagem Hospital da Beneficência Portuguesa de São Paulo and Hospital Santa Catarina, São Paulo, SP, Brazil. 5. MD, Neuroradiologist, Professor of Radiology, Director of the Neuroradiology Fellowship Program, McGill University Health Centre (MUHC), Montreal, Quebec, Canada. Mailing Address: Dr. Fabrício Guimarães Gonçalves Department of Diagnostic Radiology, Montreal General Hospital 1650 Cedar Avenue Montreal, Quebec, Canada H3G 1A4 E-mail: goncalves.neuroradio@gmail.com Received March 23, 2010. Accepted after revision October 5, 2010. Study developed at the Montreal General Hospital, McGill University Health Centre (MUHC), Montreal, Quebec, Canada. |
|
Av. Paulista, 37 - 7° andar - Conj. 71 - CEP 01311-902 - São Paulo - SP - Brazil - Phone: (11) 3372-4544 - Fax: (11) 3372-4554