Radiologia Brasileira - Publicação Científica Oficial do Colégio Brasileiro de Radiologia
AMB - Associação Médica Brasileira CNA - Comissão Nacional de Acreditação
 Vol. 53 nº 4 - July / Aug. of 2020
|
ORIGINAL ARTICLE
|
|
Comparison between STIR and T2-weighted SPAIR sequences in the evaluation of inflammatory sacroiliitis: diagnostic performance and signal-to-noise ratio |
|
|
Autho(rs): Vitor Faeda Dalto1,a; Rodrigo Luppino Assad1,b; Mario Müller Lorenzato2,c; Michel Daoud Crema3,d; Paulo Louzada-Junior1,e; Marcello Henrique Nogueira-Barbosa1,f |
|
|
Keywords: Sacroiliitis; Sacroiliac joint; Magnetic resonance imaging; Spondyloarthropathies; Signal-to-noise ratio. |
|
|
Abstract: INTRODUCTION
Early diagnosis is essential for the treatment of axial spondyloarthritis(1), and magnetic resonance imaging (MRI) is the recommended imaging method because it is able to identify findings corresponding to the phase of active inflammation, before the appearance of radiographic findings(1,2). On MRI, active inflammation is characterized by the presence of subchondral bone marrow edema in fluid-sensitive sequences or by contrast enhancement of bone marrow(2). Previously, the Assessment of SpondyloArthritis International Society (ASAS) MRI working group recommended the use of short-tau inversion-recovery (STIR) sequences to identify the bone marrow edema that is indicative of active inflammation of the subchondral tissue(3). More recently, the ASAS MRI working group began to recommend the use of T2-weighted fluid-sensitive sequences, such as STIR sequences, as well as T2-weighted sequences with fat suppression, for that purpose(4). In 2017, two different groups of researchers compared STIR sequences with other fluid-sensitive sequences in terms of their ability to detect active inflammation of the sacroiliac joints and found no superiority of the STIR sequences over T2-weighted spectral attenuated inversion-recovery (T2 SPAIR) sequences and T2-weighted Dixon sequences, respectively(5,6). The signal-to-noise ratio (SNR) is an important parameter in the objective assessment of MRI image quality(7), being one of the parameters used in the American College of Radiology (ACR) MRI accreditation program(8). The SNR is a measure of the relationship between the pure signal coming from the studied tissue, which is the signal we truly want to detect, and the background noise. A higher SNR corresponds to a lower effect of background noise on signal detection or measurement. A lower SNR results in an image with a grainy aspect that makes it difficult to analyze the original signal. To our knowledge, there have been no studies comparing the SNR of STIR sequences with that of T2 SPAIR sequences in the evaluation of the sacroiliac joints in 1.5-T MRI scanners. Therefore, the objective of this study was to perform a comparative analysis of T2 SPAIR and STIR sequences in terms of the SNR in the sacroiliac region and in terms of their diagnostic performance in the detection of active inflammation of the sacroiliac joints. MATERIALS AND METHODS This was a retrospective, cross-sectional study in which we included consecutive patients undergoing MRI of the sacroiliac joints at our institution between 2012 and 2014. We included patients between 18 to 65 years of age who were under clinical suspicion of having spondyloarthritis. A total of 69 patients were considered eligible. The images were evaluated in accordance with the ASAS criteria for the diagnosis of axial spondyloarthritis. We also calculated sensitivity and specificity. The study was approved by the local research ethics committee (Ref. 30607314.9.0000.5440). Because of the retrospective nature of the study, the requirement for written informed consent was waived. The images were anonymized and evaluated with the open-source software Horos, version 2.1.1 (The Horos Project) to determine the SNR. Because the sample size calculation indicated that at least 30 examinations would be necessary in order to carry out the SNR assessment with adequate statistical power, we selected the MRI examinations of 60 patients. In ten of those examinations, the field of view did not include the air space necessary to perform the reading, all of those examinations consequently being excluded from the assessment. Therefore, the final sample comprised 50 MRI examinations of patients under clinical suspicion of having spondyloarthritis. All MRI examinations were performed in a 1.5-T scanner (Achieva; Philips Medical Systems, Best, The Netherlands), with a 17-channel spine coil and the patients in the supine position. The protocol employed for evaluating sacroiliitis includes the following: T1-weighted coronal sequences; coronal STIR sequences; coronal T2 SPAIR sequences; and T1-weighted gadolinium-enhanced spectral presaturation with inversion recovery (T1 SPIR Gd+) sequences. The acquisition parameters for the sequences are shown in Table 1. The mean total acquisition time per patient ranged from 22 min to 25 min. The images acquired are similar to that illustrated in Figure 1. 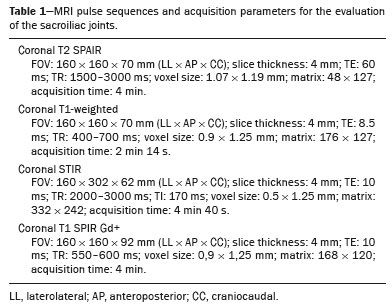  Figure 1. Male, 42 years old, diagnosed with ankylosing spondylitis. Coronal oblique MRI images. SPAIR T2 (a), STIR (b), T1 weighted without fat suppression (c), and SPIR T1 Gd + (d) sequences. The white arrows indicate areas of subchondral bone edema in both sacroiliac joints involving the iliac and sacral portions. The white arrowheads indicate intra-articular enhancement in the SPIR T1 Gd + sequence. The black arrows indicate areas of erosion on the iliac margin of the left sacroiliac. The SNR was calculated by using the method recommended by the ACR(8). In brief, the SNR is obtained by dividing the mean signal for a region of interest (ROI), designated the signal ROI, by the standard deviation obtained in another ROI positioned over the signal-free air space, designated the background ROI. To measure the signal, the ACR recommends the use of an ROI of at least 50 pixels, positioned over the tissue of interest. Because radiologists evaluate spondyloarthritis by looking for changes in the subchondral bone marrow, it was decided that the signal ROI should be positioned over the bone marrow. As a reference standard for subchondral bone marrow evaluation, we chose to position the signal ROI over the central region of the sacrum. The placement of the signal ROI over the subchondral bone of the sacroiliac joint would be subject to variations related to patient pathological status (illness or health), although determining that status was not within the scope of this study, which was focused on the SNR of the sequences, regardless of the presence or absence of disease. To obtain the background noise value, the ACR suggests the creation of an ROI in the external air space surrounding the patient, in an area free of artifacts. In the 50 patients evaluated here, an air ROI with a minimum of 300 pixels (a background ROI) was selected for each sequence, the Horos software being used in order to collect the standard deviation from the background ROI (Figure 2). 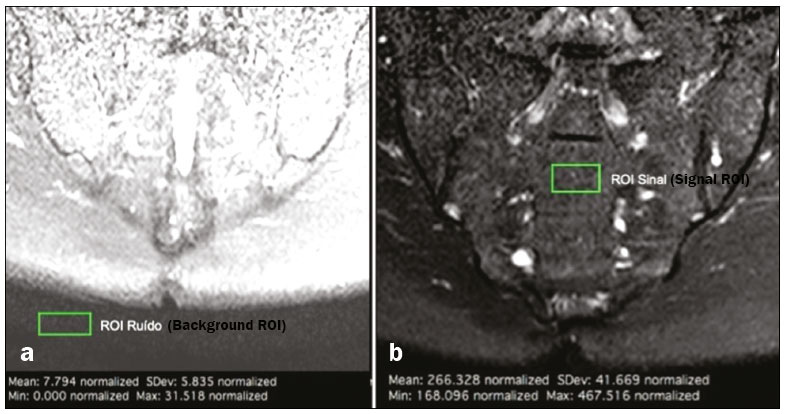 Figure 2. Acquisition of signal and noise data in the Horos program, in order to determine the SNR. a: The image shows the collection of background noise from the background ROI, positioned in the air. b: The image shows the collection of the mean bone marrow signal from the signal ROI, positioned over the central region of the sacrum. The SNR was obtained by dividing the mean signal of the signal ROI by the standard deviation of the background ROI. That calculation was performed for all three MRI sequences (T2 SPAIR, STIR, and T1 SPIR Gd+) in each the 50 patients separately, and the data were subsequently placed in a table for statistical evaluation. Two musculoskeletal radiologists with 15 years and 4 years of experience in evaluating MRI scans of the musculoskeletal system, respectively, evaluated each sequence and classified the examination as positive or negative for sacroiliitis, according to the diagnostic criteria of the ASAS working group(2). According to the ASAS criteria, examinations showing subchondral bone edema in two consecutive images or at two different sites within the sacroiliac joints are considered positive for inflammatory sacroiliitis. In the assessment of diagnostic performance, the results of the reading of the T1 SPIR Gd+ sequences were used as a reference. The positivity or negativity for inflammatory activity in the T1 SPIR Gd+ sequence was determined by consensus between the two readers. In cases of disagreement, a third radiologist, with 14 years of experience in interpreting MRI scans of the musculoskeletal system, made the final decision. Statistical analysis In the evaluation of the SNR, the correlation between sequences was performed by paired t-tests, the differences in SNRs identified for each sequence in each patient serving as the dependent variables. Sensitivity and specificity measurements were performed for each reader and for each study sequence (STIR and T2 SPAIR) in comparison with the gold standard (T1 SPIR Gd+). The level of interobserver agreement was determined by calculating the kappa statistic. Values of p < 0.05 were considered statistically significant. RESULTS In the evaluation of image quality, the mean SNR was 72.8 for the T1 SPIR Gd+ sequence, 37.6 for the T2 SPAIR sequence, and 14.1 for the STIR sequence. The distribution of the SNR values can be seen in Figure 3. 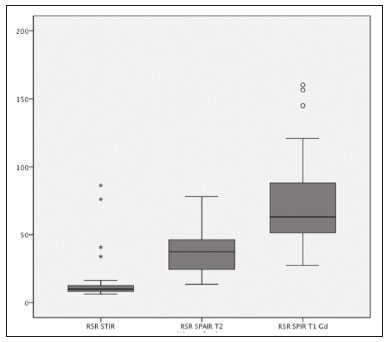 Figure 3. Box plot of the distribution of SNR values for the STIR, T2 SPAIR, and T1 SPIR Gd+ sequences. Note the high signal intensity in the T1 SPIR Gd+ sequences and the higher mean SNR for the T2 SPAIR sequences than for the STIR sequences. The comparative evaluation of the mean SNRs between the sequences, performed in a paired manner, patient by patient, by the paired t-test, revealed a difference of 58.7 (95% CI: 68.0–49.4) between T1 SPIR Gd+ and STIR, the mean SNR being significantly higher for the T1 SPIR Gd+ sequence (p < 0.000). Comparing the signal of the T2 SPAIR sequence with that of the T1 SPIR Gd+ sequence, we found a difference between the two mean SNRs of 35.2 (95% CI: 42.4–28.1), the mean SNR also being significantly higher for the T1 SPIR Gd+ sequence (p < 0.000). The difference in the mean SNR between the STIR and T2 SPAIR sequences was 23.4 (95% CI: 17.2–29.6), the mean SNR being significantly higher for the T2 SPAIR sequence (p < 0.000). The diagnostic performance of the T2 SPAIR and STIR sequences is shown in Table 2. 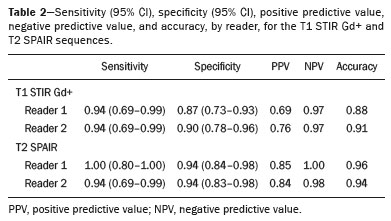 DISCUSSION In the present study, we identified a statistically significant difference in SNR between the STIR and T2 SPAIR sequences, the SNR being better for the latter. The SNR was highest for the T1 SPIR Gd+ sequence, followed by the T2 SPAIR sequence, being lowest for the STIR sequence. In the qualitative evaluation of diagnostic performance, we found no significant difference between the STIR and T2 SPAIR sequences in terms of sensitivity, specificity, accuracy, negative predictive value, or positive predictive value for the diagnosis of active inflammatory sacroiliitis, in accordance with the ASAS working group diagnostic criteria and using the T1 SPIR Gd+ sequence as the reference. Recent studies have shown that the STIR and T2 SPAIR sequences were comparable on the basis of the Spondyloarthritis Research Consortium of Canada (SPARCC) score(5,9). Our results are consistent with those findings, although we used a different method from that employed in one of those studies(5), comparing the two methods quantitatively in relation to the SNR and performing a qualitative analysis of their diagnostic performance. In that study, conducted by Dalto et al.(5), the diagnostic performance was assessed by extrapolating from the SPARCC score, whereas in our study it was calculated directly using the ASAS working group criteria for active inflammation. Dalto et al.(5) also assessed interobserver agreement among specialists in radiology and rheumatology, whereas our readers were musculoskeletal radiologists. Greese et al.(10) conducted a study comparing T2-weighted fat-saturated turbo spin-echo sequences with proton-density STIR sequences in a 3.0-T scanner and found that the former had a better SNR and was better able to identify bone edema. Although those authors reported results similar to ours for SNR, they studied the SNR in images of the sacroiliac joints acquired in 3.0-T scanners, whereas the images evaluated in our study were acquired in 1.5-T scanners. Nevertheless, the mean SNRs reported by those authors were similar to those obtained in the present study. The identification of sacroiliac joints inflammation is of great importance for the diagnosis of axial spondyloarthritis. The relevant findings in the evaluation of the sacroiliac joints include enthesitis, synovitis, capsulitis, and erosions(11). The STIR sequence is just one of the many possible methods of fat suppression, which makes it possible to identify bone edema(12,13). Currently, there are several MRI fat-saturation techniques available. The various techniques are based on the frequency of precession in the electron cloud surrounding the hydrogen proton, which is different in water than in fat. That difference makes it possible to create techniques based on the chemical shift. For fat saturation, there are techniques based on chemical shift, such as chemical-shift selective saturation, water excitation, and Dixon techniques; techniques based on inversion, such as STIR; and hybrid techniques, such as SPAIR and SPIR(14,15). Since the STIR sequence was first described by Bydder et al.(16), the technique has been widely used. It is not very sensitive to field heterogeneity and has good fat saturation, even outside the central region of the magnetic field. It also has satisfactory fat saturation, even in the presence of metal implants. The disadvantage of the STIR sequence is its low SNR. That disadvantage could be mitigated by shortening the echo time, although that also reduces the T2 weighting of the image(14). Hybrid sequences, such as SPAIR, combine an inversion-recovery pulse with an adiabatic radiofrequency pulse. Studies have shown that SPAIR sequences are relatively insensitive to field heterogeneity and tend to have better SNRs than do STIR sequences(14). In contrast, the Dixon techniques have low sensitivity to field heterogeneity and excellent SNRs, even in areas near metallic implants, those advantages being most pronounced in the three-point water-fat decomposition method(17). The image quality assessment performed in the present study also confirmed previous findings showing that the SNR is higher for SPAIR sequences than for STIR sequences(4,9,13). In our study, the T2 SPAIR sequence showed a mean SNR 2.66 times greater than that of the STIR sequence and the mean examination time was comparable between the two. This can be considered the greatest advantage of the T2 SPAIR sequence and one of the reasons for its use. Even when using similar examination times, slice thickness, and T2-weighting parameters, we found a higher SNR for the T2 SPAIR sequence. The SPAIR sequence has more options with respect to slice thickness, T2 weighting, and matrix, without substantially impairing the image quality, because it has a higher SNR(7). Our study has some limitations, including those inherent to its retrospective design. Another limitation is that the T1 SPIR Gd+ sequence with fat suppression was used as a reference to calculate the diagnostic performance of the STIR and T2 SPAIR sequences. Although subchondral tissue biopsy would probably be the ideal reference, it would be unethical to subject patients to an invasive procedure in order to validate a concept of comparing MRI sequences. Therefore, we decided to use the reference that has been most widely employed in the evaluation of active inflammation of the sacroiliac joints(5,18,19). Our findings support those reported recently in the literature, suggesting that there is no superiority of the STIR sequence over other fluid-sensitive sequences for the evaluation of subchondral bone edema of the sacroiliac joints in patients with spondyloarthritis(5,6,10). We found no difference between the STIR and T2 SPAIR sequences in terms of their diagnostic performance in identifying active inflammation of the subchondral bone tissue of the sacroiliac joints. Our results also indicate that, on 1.5-T sacroiliac joints MRI, the T2 SPAIR sequence provides a better SNR than does the STIR sequence, which reinforce that the use of T2 SPAIR sequences is a viable option for the evaluation of inflammatory sacroiliitis, with some advantage over STIR sequence. REFERENCES 1. Chary-Valckenaere I, d’Agostino MA, Loeuille D. Role for imaging studies in ankylosing spondylitis. Joint Bone Spine. 2011;78:138–43. 2. Rudwaleit M, Jurik AG, Hermann KGA, et al. Defining active sacroiliitis on magnetic resonance imaging (MRI) for classification of axial spondyloarthritis: a consensual approach by the ASAS/OMERACT MRI group. Ann Rheum Dis. 2009;68:1520–7. 3. Sieper J, Rudwaleit M, Baraliakos X, et al. The Assessment of SpondyloArthritis International Society (ASAS) handbook: a guide to assess spondyloarthritis. Ann Rheum Dis. 2009;68 Suppl 2:ii1–44. 4. Lambert RGW, Bakker PAC, van der Heijde D, et al. Defining active sacroiliitis on MRI for classification of axial spondyloarthritis: update by the ASAS MRI working group. Ann Rheum Dis. 2016; 75:1958–63. 5. Dalto VF, Assad RL, Crema MD, et al. MRI assessment of bone marrow oedema in the sacroiliac joints of patients with spondyloarthritis: is the SPAIR T2w technique comparable to STIR? Eur Radiol. 2017;27:3669–76. 6. Özgen A. The value of the T2-weighted multipoint Dixon sequence in MRI of sacroiliac joints for the diagnosis of active and chronic sacroiliitis. AJR Am J Roentgenol. 2017;208:603–8. 7. Goerner FL, Clarke GD. Measuring signal-to-noise ratio in partially parallel imaging MRI. Med Phys. 2011;38:5049–57. 8. American College of Radiology. Magnetic resonance imaging (MRI) quality control manual: 2004. Reston, VA: American College of Radiology; 2004. 9. Boy FN, Kayhan A, Karakas HM, et al. The role of multi-parametric MR imaging in the detection of early inflammatory sacroiliitis according to ASAS criteria. Eur J Radiol. 2014;83:989–96. 10. Greese J, Diekhoff T, Sieper J, et al. Detection of sacroiliitis by short-tau inversion recovery and T2-weighted turbo spin echo sequences: results from the SIMACT study. J Rheumatol. 2019;46:376–83. 11. Castro Jr MR, Mitraud SAV, Francisco MC, et al. Spondyloarthropathy: diagnostic imaging criteria for the detection of sacroiliitis. Radiol Bras. 2017;50:258–62. 12. Navallas M, Ares J, Beltrán B, et al. Sacroiliitis associated with axial spondyloarthropathy: new concepts and latest trends. Radiographics. 2013;33:933–56. 13. Rudwaleit M, van der Heijde D, Landewé R, et al. The development of Assessment of SpondyloArthritis International Society classification criteria for axial spondyloarthritis (part II): validation and final selection. Ann Rheum Dis. 2009;68:777–83. 14. Del Grande F, Santini F, Herzka DA, et al. Fat-suppression techniques for 3-T MR imaging of the musculoskeletal system. Radiographics. 2014;34:217–33. 15. Pezeshk P, Alian A, Chhabra A. Role of chemical shift and Dixon based techniques in musculoskeletal MR imaging. Eur J Radiol. 2017;94:93–100. 16. Bydder GM, Pennock JM, Steiner RE, et al. The short TI inversion recovery sequence—an approach to MR imaging of the abdomen. Magn Reson Imaging. 1985;3:251–4. 17. Yu H, Reeder SB, Shimakawa A, et al. Field map estimation with a region growing scheme for iterative 3-point water-fat decomposition. Magn Reson Med. 2005;54:1032–9. 18. Bozgeyik Z, Ozgocmen S, Kocakoc E. Role of diffusion-weighted MRI in the detection of early active sacroiliitis. AJR Am J Roentgenol. 2008;191:980–6. 19. Madsen KB, Egund N, Jurik AG. Grading of inflammatory disease activity in the sacroiliac joints with magnetic resonance imaging: comparison between short-tau inversion recovery and gadolinium contrast-enhanced sequences. J Rheumatol. 2010;37:393–400. 1. Faculdade de Medicina de Ribeirão Preto da Universidade de São Paulo (FMRP-USP), Ribeirão Preto, SP, Brazil 2. Radiologia Especializada de Ribeirão Preto, Ribeirão Preto, SP, Brazil 3. Institut National du Sport, de l’Expertise et de la Performance (INSEP), Paris, France a. https://orcid.org/0000-0003-4921-183X b. https://orcid.org/0000-0002-8430-8357 c. https://orcid.org/0000-0003-1551-7734 d. https://orcid.org/0000-0001-8582-0793 e. https://orcid.org/0000-0003-2585-3870 f. https://orcid.org/0000-0002-7436-5315 Correspondence: Dr. Marcello H. Nogueira-Barbosa Departamento de Imagens Médicas, Hematologia e Oncologia Clínica – FMRP-USP Avenida Bandeirantes, 3900, Campus Universitário, Monte Alegre Ribeirão Preto, SP, Brazil, 14048-900 Email: marcello@fmrp.usp.br Received 9 June 2019 Accepted after revision 24 October 2019 Publication date: 15/06/2020 |
|
Av. Paulista, 37 - 7° andar - Conj. 71 - CEP 01311-902 - São Paulo - SP - Brazil - Phone: (11) 3372-4544 - Fax: (11) 3372-4554