Radiologia Brasileira - Publicação Científica Oficial do Colégio Brasileiro de Radiologia
AMB - Associação Médica Brasileira CNA - Comissão Nacional de Acreditação
 Vol. 53 nº 3 - May / June of 2020
|
ORIGINAL ARTICLE
|
|
Comparison of automated and manual protocols for magnetic resonance imaging assessment of liver iron concentration |
|
|
Autho(rs): Izabella de Campos Carvalho Lopes1,a; Manuel Schütze1,b; Marina Borges Bolina1,c; Tarcísio Ângelo de Oliveira Sobrinho1,d; Laura Filgueiras Mourão Ramos1,e; Renata Lopes Furletti Caldeira Diniz1,f; Juliano Lara Fernandes2,g; Maria Helena Albernaz Siqueira1,h |
|
|
Keywords: Liver/diagnostic imaging; Liver/metabolism; Iron overload/diagnostic imaging; Iron/metabolism; Magnetic resonance imaging/methods; Image processing, computer-assisted/methods. |
|
|
Abstract: INTRODUCTION
Iron overload usually results from chronic blood transfusion therapy for any one of several types of anemia(13) or disorders of iron absorption such as hereditary hemochromatosis(2,4). Because the liver accounts for more than 70% of somatic iron storage(1,2), the liver iron concentration (LIC) is an excellent surrogate marker for the whole-body iron load(1,3,5), as well as helping predict the risk of intrahepatic and extrahepatic complications(3). Biochemical analysis of a liver biopsy is the gold standard for the measurement of LIC(38) and is expressed as either mg/g liver (dry weight), with a maximum normal value of 2 mg/g, or as µmol/g, with a maximum normal value of 36 µmol/g(9). However, because liver biopsy is an invasive method, magnetic resonance imaging (MRI) is chosen as the method for LIC measurement with everincreasing frequency(39). MRI emerged as the dominant modality for LIC measurement because of its sensitivity, reproducibility, availability, and ability to evaluate multiple organs of the body during a single imaging session(3,5,7,10). MRI quantifies iron indirectly by detecting the paramagnetic effects of iron stores in the forms of ferritin and hemosiderin, interacting with nearby hydrogen nuclei. A number of empirical MRI methods for the determination of tissue iron overload have been proposed(6). This has been traditionally done using manual methods, which are well-established and are validated and calibrated against the gold standard of liver biopsy, but are more user dependent and take more time to perform. More recently though, automatic methods have been proposed, with the advantage of speed and ease of use. The aim of this study was to compare automated and manual MRI protocols for estimating LIC at 1.5 T. MATERIALS AND METHODS Study design and population This was a prospective single-center study of patients who were referred to our department for liver MRI because of suspected hepatic iron overload. We included patients with an elevated serum ferritin level (> 300 µg/L in male patients and > 200 µg/L in female patients) or elevated transferrin saturation (> 45% in male patients and > 50% in female patients). Thus, 60 eligible patients were identified. Subjects with the following conditions were excluded from the study: claustrophobia (n = 2); inability to consent (n = 1); and liver nodules detected on MRI (n = 4). Therefore, the final study group comprised 53 patients. We also evaluated 21 healthy controls, selected by convenience, with no history of liver or metabolic disease. All examinations were performed between October 2014 and August 2017. Age, gender, and body mass index were recorded for patients and controls. The study was approved by the local research ethics committee, and all participants gave written informed consent. MRI techniques Unenhanced images were acquired in a 1.5 T scanner (Magnetom Avanto; Siemens Healthcare, Erlangen, Germany), with a body coil and dedicated software, version syngo MR B17. For the signal-intensity-ratio method proposed by the University of Rennes (URennes), we acquired five axial gradient-echo (GRE) sequences of the liver with a repetition time (TR) of 120 ms. A typical T1-weighted sequencewith an in-phase echo time (TE) of 4 ms and a flip angle of 90°was followed by four sequences with a standard flip angle of 20° and progressively increasing T2-weightingin-phase TE increasing from 4 to 21 ms(4,6,11,12). For the manual T2* protocol, a multi-echo GRE (mGRE) sequence was used in order to acquire 12 images with increasing TE (range, 1.316.9 ms, with 1.4 ms intervals), a TR of 200 ms, a flip angle of 20°, a field of view of 400 × 400 mm2, a matrix of 96128 × 6496, and a slice thickness of 10 mm(10). Automated T2* and T1 maps were generated by in-line processing prototype software, the same used in the All Iron Detected Multicenter Study(13). Acquisition of mGRE sequences with radiofrequency spoiling was used in order to create the T2* map(1416). The T1 map was acquired by using a modified look-locker inversion recovery (MOLLI) sequence with the 5(3)3 protocol(14,17,18). Liver MRI analysis Data were analyzed by two radiologists (with ten and three years of experience in abdominal radiology, respectively), both of whom were blinded to the clinical status of the subjects, and the level of interobserver agreement was assessed. One of the radiologists also repeated all measurements, in order to allow intraobserver agreement to be assessed. Four methods for estimating LIC values were evaluated in this study. The two manual methods were well-established at the time of the study design: the URennes (signal-intensity-ratio) method proposed by Gandon et al.(11); and the manual T2* (relaxometry) method proposed by Hankins et al.(10). Both have been validated and calibrated against the gold standard of liver biopsy and show that MRI enables good quantification of LIC(1012,1925). The two automatic methods evaluated were the ultrafast scanning T2* and T1 mapping techniques(1318), which were proposed more recently URennes method For quantification of the URennes values, we used the algorithm developed by Gandon et al.(11). That algorithm uses the liver-to-muscle signal intensity ratios in five axial GRE sequences of the liver. For every sequence, we measured liver signal intensity (SI) in three operator-defined regions of interest (ROIs) of 13 cm2 in the right lobe of the liver, avoiding large vessels, biliary tracts, parenchymatous lesions, and artifacts. Muscle SI was measured in two ROIs in the right and left paraspinal muscles. The ROIs were propagated to all five images. Values were entered manually on a website developed by the authors(12), which provides LIC values in µmol Fe/g. Manual T2* mapping We drew freehand ROIs directly on the scanner console over source images in a homogeneous area of the right hepatic lobe, at the level of the origin of the main portal vein, avoiding blood vessels and visible bile ducts. The SI was obtained and transferred manually to the software on another computer. The mean SI in each slice with varying TEs was used in order to fit the T2* curve by using the formula SI = Ke−T2*/TE, with truncation of the decay curve to achieve the best results, in accordance with previous recommendations(10). The TEs were manually excluded from the fit in images with high iron-mediated signal loss. The T2* values were transformed into their reciprocal R2* (R2*[Hz] = 1,000/T2*[ms]). The LIC values (in mg Fe/g) were estimated from R2* values using the linear regression model described by Hankins et al.(10). T2* mapping Automated T2* maps were calculated using in-line processing prototype software and were based on the original mGRE images of the liver. The T2* values (in ms) were obtained by drawing an ROI directly onto the map generated(1316). The LIC values (in mg Fe/g) were estimated by using the linear regression model described by Hankins et al.(10). T1 mapping The T1 map was measured in six circular ROIs larger than 1 cm2 (range, 13 cm2). We placed four ROIs in the right lobe and two in the left lobe, avoiding artifacts, major vascular structures, and lesions. The prototype software generated a native image with multiple echoes, as well as final T1 maps that had already been processed automatically(14,17,18). In our calculations, we used the arithmetic mean of those ROIs. The T1 values were transformed into their reciprocal R1 values (R1[Hz] = 1000/T1[ms]), which increase during iron overload. It was not possible to estimate LIC values based on R1, because there is as yet no conversion formula for those two measures. Statistical analysis For the calculation of descriptive statistics, numerical variables were submitted to the ShapiroWilk test of normality. Those variables are presented as mean ± standard deviation (SD) when normally distributed and as median (interquartile range) when not. Categorical variables are presented as frequencies and percentages. We compared patients and control subjects using the t-test for normally distributed variables or the MannWhitneyWilcoxon test for those not so distributed. Categorical values were compared by the chi-square test. Measures obtained with the URennes, manual T2*, automated T2* mapping, and T1 mapping protocols were compared by constructing receiver operating characteristic (ROC) curves, and the performance of the protocols was assessed by calculating the area under the curve (AUC) and the corresponding 95% confidence interval (95% CI). Correlations between measures were quantified by calculating Spearmans correlation coefficient. The intraclass correlation coefficient (ICC) was calculated in order to determine the level of interobserver and intraobserver agreement(26), and the Students t-test for independent samples (difference equal to zero) was used for the analysis of differences between means. Statistical analyses were performed with R software, version 3.3.2 (R Foundation for Statistical Computing, Vienna, Austria). Values of p < 0.05 were considered statistically significant. RESULTS Sample characteristics In this study, we assessed LICs in 74 individuals (53 patients and 21 controls). The subject characteristics are summarized in Table 1. Patients did not differ significantly from healthy control subjects with respect to gender, age, height, or the presence of hepatic steatosis. However, the control subjects had lower body weights (p < 0.001). Among the patients, the mean serum ferritin was 974 µg/L in the males and 1542 µg/L in the females. 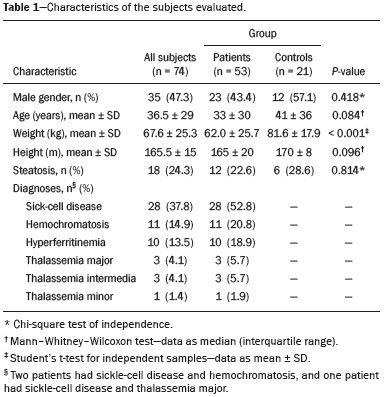 Reliability of the measures The interobserver analysis showed no significant difference between the two radiologists, with excellent agreement between the measurements (Table 2). Because the agreement between the two raters for all methods was high, correlation and ROC curve analyses were performed using the measures obtained by the first rater. The intraobserver analysis showed no significant difference between repeated measures by the same radiologist for all of the methods, except for T1 mapping (p < 0.05), despite the fact that the ICC for agreement between the two raters was above 0.9 for all of the protocols (Table 2). 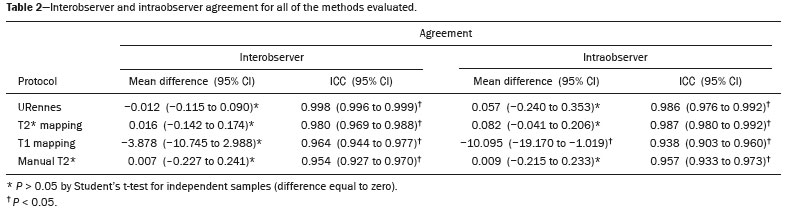 Performance of the protocols The scan times and average image analysis durations are listed in Table 3. Values measured by each protocol, for patients and controls, are shown in Figure 1. The URennes and manual T2* protocols showed good power of discrimination between patients and controls (AUC > 0.9). The T2* mapping protocol also had an AUC above 0.9, although the T1 mapping protocol performed poorly, with an AUC of only 0.8 (95% CI: 7090.4%), and differed significantly from the other protocols: URennes (p = 0.008); manual T2* (p = 0.038); and T2* mapping (p = 0.031). The URennes, manual T2*, and T2* mapping protocols had similar power to detect patients with elevated ferritin or transferrin saturation and clinically suspected hepatic iron overload (Figure 2). 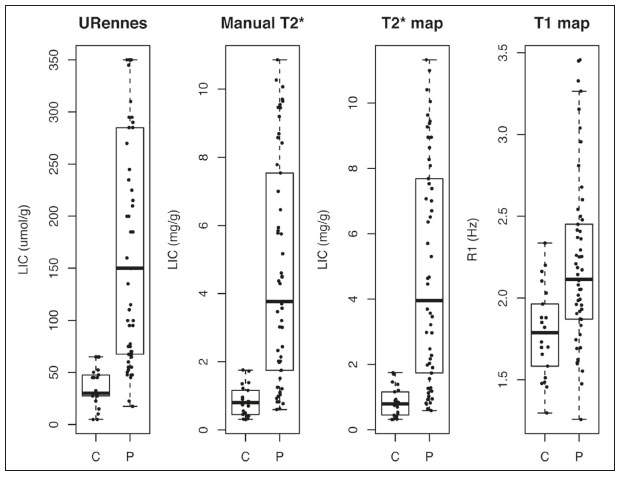 Figure 1. Values obtained using the URennes, manual T2*, T2* mapping, and T1 mapping protocols for patients and controls. C, controls; P, patients. 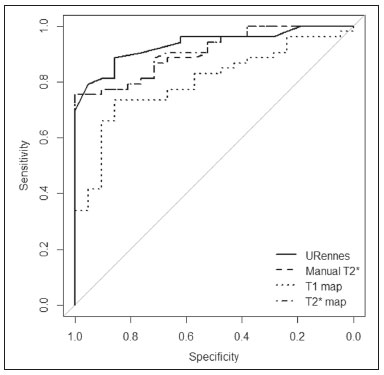 Figure 2. ROC curves using the URennes, manual T2*, T2* mapping, and T1 mapping protocols for separating patients and controls. The AUC (95% CI) was 0.934 (0.8810.988) for URennes; 0.908 (0.8440.972) for manual T2*; 0.80 (0.700.904) for T1 mapping; and 0.912 (0.8490.974) for T2* mapping. The T1 mapping curve differs significantly from those of URennes (p = 0.008), manual T2* (p = 0.038), and T2* mapping (p = 0.031). 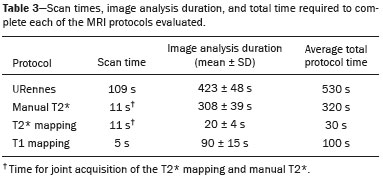 Correlations among LIC measures obtained by the URennes, T2* mapping, and manual T2* protocols To study the relationships among measures obtained by the URennes, T2* mapping, manual T2*, and T1 mapping protocols, we calculated the correlation coefficients. The results are shown in Figure 3. All measures showed a significant correlation among the protocols, and the correlation coefficients were above 0.9 for the URennes, T2* mapping, and manual T2* protocols, although those associations were weaker when the URennes-measured LIC was above 350 µmol Fe/g. The strongest correlation observed was between the T2* mapping-measured LICs and those measured with the T2* manual protocol (r = 0.979). Correlations involving R1 values obtained with the T1 mapping protocol, although still significant, were lower, probably due to the great dispersion of R1 values. The T1 mapping protocol correlated most strongly with the URennes protocol (r = 0.814; p < 0.001). 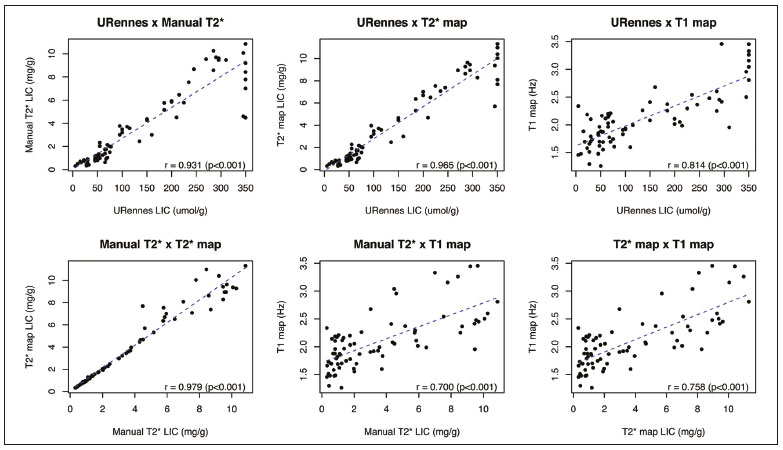 Figure 3. Correlations among the protocols. The blue line represents the fitted linear model. r, Spearmans correlation coefficient (p-values refer to the correlation coefficient). DISCUSSION In this study, we applied different methods of LIC estimation using 1.5 T MRI in a group of 53 patients and 21 controls and compared the results between manual and automatic methods. The main advantages of the mapping techniques are speed and ease of use. That was confirmed in our study, in which the time required for image acquisition/processing was found to be significantly shorter for the T2* mapping and T1 mapping protocols than for the URennes and manual T2* protocols. Shortly after the conclusion of the data collection for this study in 2017, the URennes published a study proposing a new method that employs a proton density technique, involving the use of magnitude images, and has produced quite promising results(9). The authors of that study showed that the URennes method employed in the present study tends to overestimate LIC values and is susceptible to potentially serious errors if coils other than an antenna coil are employed. They recommended migrating to the Digital Imaging and Communication in Medicine MRQuantIF software that uses the Alústiza algorithm by default(21), which controls the acquisition parameters(9). Because that software would require the re-acquisition of imaging data using a different protocol, the remainder of the discussion will focus primarily on the manual T2*, T2* mapping, and T1 mapping protocols. In the present study, the level of interobserver agreement was good, the ICC being above 0.9 for all four protocols. The level of intraobserver agreement was also good, although the t-test showed a significant difference between measures obtained with the T1 mapping protocol. That is likely related to the higher dispersion of R1 values estimated using this method. Native T1 mapping detects elevated levels of extracellular water, thus identifying fibrosis(18), which is reflected in an increased T1 value. However, the presence of excess iron competes with this effect, reducing T1 (and conversely increasing R1). The most widely used T1 mapping sequence is based on the MOLLI technique. Described originally by Messroghli et al.(27), it consists of a single-shot true fast imaging with steady-state precession sequence with acquisitions over different inversion time readouts, allowing for magnetization recovery of a few seconds after three to five readouts. The advantages of this sequence are its acquisition in only one relatively short breath-hold, the higher spatial resolution (1.6 × 2.3 × 8 mm), and the increased dynamic signal. T1 maps are generated automatically after MOLLI image acquisition, without the need for further post-processing, which accelerates image analysis. Similarly, in-line application of motion correction provides more accurate pixel-wise maps, avoiding artifacts due to respiratory motion. Torlasco et al.(28) demonstrated that T1 mapping correlates better with cardiac and hepatic iron levels than does T2* mapping. Despite those advantages, we found that T1 mapping showed the lowest ICC, the weakest correlation with the other methods, and the lowest AUC for differentiating patients from controls. Therefore, although we found a significant correlation with the R1 and LIC values estimated by the other methods, there is no clear evidence that T1 mapping could consistently estimate LIC values through the use of the protocol applied in this study. Nevertheless, there are many T1 sequences other than MOLLI that could be usedincluding shortened MOLLI, saturation recovery single-shot acquisition, saturation-pulse prepared heart-rate-independent inversionrecovery, and inversion time scouteach with different reference values. Further studies are needed in order to examine the relationship between R1 values and LIC. There were strong correlations among the URennes, manual T2*, and T2* mapping protocols regarding LIC estimation, and all correlations with the URennes protocol were significant, although the correlations among LIC measures were weaker when the LIC was above 15 mg Fe/g. This corroborates current knowledge that there is saturation at 1.5 T with very high iron overload, consequently, the method cannot quantify LIC values greater than 375 µmol/kg (20.9 mg/kg) and hence does not capture the entire relevant range of values(2). For T2* calculations, depending on the MRI scanner gradient system, liver T2* can measure LICs only up to 40 mg/g(29). Thats because GRE sequences are inaccurate at higher iron overload levels(2,4,10,22,25), given that the mGRE techniques employed are intrinsically limited when detecting rapidly decaying MRI signals. Nevertheless, higher LIC values can be measured with this method, because conventional mGRE techniques only start to become degraded during the measurement of signals with T2* times ≤ 1 ms, corresponding to LIC values above approximately 25 mg Fe/g liver (dry weight) at 1.5 T(10,25). In contrast, dAssignies et al.(5), in a study comparing and validating the signal-intensity-ratio method and the R2* method with liver biopsy at 3.0 T, demonstrated that the biopsy-determined LIC correlates better with that determined by the R2* method than with that determined by the signalintensity-ratio method when the degree of iron overload is slight to moderate (< 130 µmol/g). However, in patients with a high biopsy-determined LIC (≥ 130 µmol/g), the signal-intensity-ratio method correlates better. The strongest correlation between methods was observed for that between the automated T2* mapping and manual T2* protocols. We find that interesting, because those two methods use the same image source for calculations, as well as because the time required for image acquisition and processing is approximately ten times shorter for the automated T2* mapping protocol than for the manual T2* protocol. In the present study, we chose to use the conversion proposed by Hankins et al.(10) for the manual T2* analysis. Those authors compared R2* values to the biopsy-determined LIC, using three different MRI methods, demonstrating that the estimations obtained with the shortest first TE correlated most strongly with the directly measured values(4,10). Those values are easily calculated with a Microsoft® Excel spreadsheet, on which myocardial and hepatic iron concentrations can be estimated by inputting the mean SI values for each TE. Parametric maps require specific sequences and software capable of performing the curve fits and generating maps without the need for manual user input. Unfortunately, there is great heterogeneity among the sequences and software implemented by different MRI equipment manufacturers, resulting in variation among estimated LIC measures. This is a major limiting factor for the use of this method in clinical practice. Nevertheless, studies have shown that T2* mapping can detect liver hemosiderosis(30) and can accurately identify high concentrations of iron(7). In the present study, we found that T2* mapping produced results similar to those of manual T2*, with low levels intraobserver and interobserver variability. Our study has some limitations. We employed only one 1.5 T MRI scanner, and it was therefore not possible to compare reproducibility between or among different devices. In addition, we included a limited number of subjects, especially in the control group. We also had no measure of serum ferritin in the control subjects and therefore cannot exclude the possibility of iron deposition, which can be seen in asymptomatic patients, in that group. CONCLUSION Our findings indicate that T2* mapping of the liver is a promising new tool for the rapid diagnosis of hepatic iron overload, and that T1 mapping is less accurate for that purpose. Further studies are needed in order to improve understanding the value of T1 mapping in clinical practice and to propose changes to overcome intrinsic limitations of the manual T2* protocol in LIC estimation. There are various robust T2* methods that could be routinely used for estimating LIC. REFERENCES 1. Wood JC, Ghugre N. Magnetic resonance imaging assessment of excess iron in thalassemia, sickle cell disease and other iron overload diseases. Hemoglobin. 2008;32:8596. 2. Sirlin CB, Reeder SB. Magnetic resonance imaging quantification of liver iron. Magn Reson Imaging Clin N Am. 2010;18:35981. 3. Wood JC. Magnetic resonance imaging measurement of iron overload. Curr Opin Hematol. 2007;14:18390. 4. Alústiza Echeverría JM, Castiella A, Emparanza JI. Quantification of iron concentration in the liver by MRI. Insights Imaging. 2012;3:17380. 5. dAssignies G, Paisant A, Bardou-Jacquet E, et al. Non-invasive measurement of liver iron concentration using 3-Tesla magnetic resonance imaging: validation against biopsy. Eur Radiol. 2018;28: 202230. 6. Christoforidis A, Perifanis V, Spanos G, et al. MRI assessment of liver iron content in thalassamic patients with three different protocols: comparisons and correlations. Eur J Haematol. 2009;82:388 92. 7. Banerjee R, Pavlides M, Tunnicliffe EM, et al. Multiparametric magnetic resonance for the non-invasive diagnosis of liver disease. J Hepatol. 2014;60:6977. 8. Wood JC, Zhang P, Rienhoff H, et al. Liver MRI is more precise than liver biopsy for assessing total body iron balance: a comparison of MRI relaxometry with simulated liver biopsy results. Magn Reson Imaging. 2015;33:7617. 9. Gandon Y. About MRQuantif software. [cited 2019 Mar 20]. Available from: https://imagemed.univ-rennes1.fr/en/mrquantif/about. 10. Hankins JS, McCarville MB, Loeffler RB, et al. R2* magnetic resonance imaging of the liver in patients with iron overload. Blood. 2009;113:48535. 11. Gandon Y, Olivié D, Guyader D, et al. Non-invasive assessment of hepatic iron stores by MRI. Lancet. 2004;363:35762. 12. Gandon Y. Hepatic iron & fat. [cited 2020 March 19]. Available from: https://imagemed.univ-rennes1.fr/en/mrquantif/quantif/. 13. Fernandes JL, Siqueira MHA, Oliveira KTN, et al. Automated T2* maps of the heart and liver in comparison to manual analysis for iron overload assessment in the All Iron Detected (AID) multicenter study. J Cardiovasc Magn Res. 2015;17(Suppl 1):W18. 14. Maestrini V, Abdel-Gadir A, Herrey AS, et al. New generation cardiac parametric mapping: the clinical role of T1 and T2 mapping. [cited 2020 March 19]. Available from: https://static.healthcare.siemens. com/siemens_hwem-hwem_ssxa_websites-context-root/wcm/idc/groups/public/@global/@imaging/@mri/documents/download/mday/ mjq2/~edisp/clinical_role_of_t1_and_t2_mapping-01176232.pdf. 15. Wassmuth R, Prothmann M, Utz W, et al. Variability and homogeneity of cardiovascular magnetic resonance myocardial T2-mapping in volunteers compared to patients with edema. J Cardiovasc Magn Reson. 2013;15:27. 16. Pennell DJ, Udelson JE, Arai AE, et al. Cardiovascular function and treatment in β-thalassemia major: a consensus statement from the American Heart Association. Circulation. 2013;128:281308. 17. Fernandes JL, Strecker R, Greiser A, et al. Myocardial T1-mapping: techniques and clinical applications. [cited 22020 March 19]. Available from: https://static.healthcare.siemens.com/siemens_hwemhwem_ ssxa_websites-context-root/wcm/idc/groups/public/@global/@imaging/@mri/documents/download/mdaw/mte5/~edisp/myocardial_ t1_mapping_techniques_clinical_applications-00118083.pdf. 18. Moon JC, Messroghli DR, Kellman P, et al. Myocardial T1 mapping and extracellular volume quantification: a Society for Cardiovascular Magnetic Resonance (SCMR) and CMR Working Group of the European Society of Cardiology consensus statement. J Cardiovasc Magn Reson. 2013;15:92. 19. Ernst O, Rose C, Sergent G, et al. Hepatic iron overload: quantification with MR imaging at 1.5 T. AJR Am J Roentgenol. 1999; 172:11412. 20. Castiella A, Alústiza JM, Emparanza JI, et al. Liver iron concentration quantification by MRI: are recommended protocols accurate enough for clinical practice? Eur Radiol. 2011;21:13741. 21. Alústiza JM, Emparanza JI, Castiella A, et al. Measurement of liver iron concentration by MRI is reproducible. Biomed Res Int. 2015;2015:294024. 22. Anderson LJ, Holden S, Davis B, et al. Cardiovascular T2-star (T2*) magnetic resonance for the early diagnosis of myocardial iron overload. Eur Heart J. 2001;22:21719. 23. St Pierre TG, Clark PR, Chua-anusorn W, et al. Noninvasive measurement and imaging of liver iron concentrations using proton magnetic resonance. Blood. 2005;105:85561. 24. Garbowski MW, Carpenter JP, Smith G, et al. Biopsy-based calibration of T2* magnetic resonance for estimation of liver iron concentration and comparison with R2 Ferriscan. J Cardiovasc Magn Reson. 2014;16:40. 25. Henninger B, Zoller H, Rauch S, et al. R2* relaxometry for the quantification of hepatic iron overload: biopsy-based calibration and comparison with the literature. Rofo. 2015;187:4729. 26. Buckens CF, de Jong PA, Mol C, et al. Intra and interobserver reliability and agreement of semiquantitative vertebral fracture assessment on chest computed tomography. PloS One. 2013;8:e71204. 27. Messroghli DR, Radjenovic A, Kozerke S, et al. Modified Look- Locker inversion recovery (MOLLI) for high resolution T1 mapping of the heart. Magn Reson Med. 2004;52:1416. 28. Torlasco C, Cassinerio E, Roghi A, et al. Role of T1 mapping as a complementary tool to T2* for non-invasive cardiac iron overload assessment. PLoS One. 2018;13:e0192890. 29. Wood JC. Estimating tissue iron burden: current status and future prospects. Br J Haematol. 2015;170:1528. 30. Cassinotto C, Feldis M, Vergniol J, et al. MR relaxometry in chronic liver diseases: comparison of T1 mapping, T2 mapping, and diffusion- weighted imaging for assessing cirrhosis diagnosis and severity. Eur J Radiol. 2015;84:145965. 1. Radiology and Diagnostic Imaging, Hospital Mater Dei, Pós-Graduação Ciências Médicas de Minas Gerais (PGCM-MG), Belo Horizonte, MG, Brazil 2. Cardiovascular Imaging Center, Jose Michel Kalaf Research Institute, Campinas, SP, Brazil a. https://orcid.org/0000-0001-9735-219X b. https://orcid.org/0000-0003-1947-9675 c. https://orcid.org/0000-0002-8714-5338 d. https://orcid.org/0000-0003-1877-1041 e. https://orcid.org/0000-0003-4201-0525 f. https://orcid.org/0000-0002-7008-8066 g. https://orcid.org/0000-0002-6726-5324 h. https://orcid.org/0000-0003-3048-650X Correspondence: Dra. Izabella de Campos Carvalho Lopes Radiologia e Diagnóstico por Imagem, Hospital Mater Dei Rua Gonçalves Dias, 2700, Santo Agostinho Belo Horizonte, MG, Brazil, 30190-094 Email: izabellaccl@gmail.com Received 19 February 2019 Accepted after revision 12 September 2019 Publication date: 24/03/2020 |
|
Av. Paulista, 37 - 7° andar - Conj. 71 - CEP 01311-902 - São Paulo - SP - Brazil - Phone: (11) 3372-4544 - Fax: (11) 3372-4554