Radiologia Brasileira - Publicação Científica Oficial do Colégio Brasileiro de Radiologia
AMB - Associação Médica Brasileira CNA - Comissão Nacional de Acreditação
 Vol. 48 nº 1 - Jan. /Feb. of 2015
|
ORIGINAL ARTICLE
|
|
Value of renal cortical thickness as a predictor of renal function impairment in chronic renal disease patients |
|
|
Autho(rs): Samia Rafael Yamashita1; Augusto Castelli von Atzingen2; Wagner Iared3; Alexandre Sérgio de Araújo Bezerra4; Adriano Luiz Ammirati5; Maria Eugênia Fernandes Canziani6; Giuseppe D'Ippolito7 |
|
|
Keywords: Ultrasonography; Chronic renal disease; Chronic renal failure; Renal cortex; Glomerular filtration rate. |
|
|
Abstract: INTRODUCTION
The prevalence of chronic kidney disease (CKD) has increased worldwide because of the growing numbers of cases of diabetes, hypertension, and obesity, in addition to the aging of the general population(1). In general, CKD may be evaluated by the 24-hour urine creatinine clearance test(1), and, in the clinical practice, ultrasonography (US) is used in the initial evaluation of CKD patients for three major reasons, as follows: 1) to rule out potentially reversible causes (e.g., collecting system dilatation); 2) to make a decision about a possible renal biopsy in cases where US fails to define the CKD etiology; 3) to obtain renal measurements as a prognostic factor. Such measurements are important since in most cases CKD leads to a common final-stage condition characterized by small kidneys, cortical and parenchymal thinning (indicating atrophy) and hyperechogenicity indicating sclerosis and fibrosis (small, dense, echogenic kidneys); such findings indicate disease irreversibility and poor prognosis(2). In this context, it is desirable that one is able to predict the progression of chronic nephropathy that precedes the condition irreversibility, based on function estimates obtained by means of sonographic renal measurements. Usually, sonographic findings of CKD include: a) increased cortical echogenicity, which is considered a marker/diagnostic criterion for parenchymal nephropathy, arising from interstitial edema or fibrosis; b) decreased renal size; and c) loss of parenchyma-sinus differentiation(3-6). A recent study suggests that progressive decrease in the cortical thickness might be an early sign of renal failure(3). In a recently published study, the authors have found a linear correlation between cortical thickness and renal glomerular filtration rate (GFR) estimated with the Cockcroft-Gault equation(7). However, such study presents some limitations, namely, the small sample size; the US scans were performed by a technologist; and the measurements were obtained by consensus on imaging files, rather than in real-time during the scan. The present study was aimed at evaluating the relationship between renal cortex thickness measurements obtained in real-time by US and degree of renal injury in CKD patients, and determining the reproducibility of such measurements. MATERIALS AND METHODS Patients selection The present cross-sectional, prospective, and observational study was approved by the Committee for Ethics in Research of the authors' institution No. 188/2011. Inclusion criteria were the following: patients aged 18 years or older, of either sex, with established clinical diagnosis of clinically stable chronic renal insufficiency (CRI) of renal etiology, undergoing clinical follow-up and presenting with variable degrees of disease based on their renal GFR estimated with the Cockcroft-Gault equation, namely, level 1, renal injury with normal GFR (> 90 mL/s) (positive clinical history or glomerular hematuria, proteinuria or altered images); level 2, renal injury with slightly decreased GFR (60-89 mL/s); level 3, renal injury and moderately decreased GFR (30-59 mL/s); level 4, severely decreased GFR (15-29 mL/s); level 5, renal failure (GFR < 15 mL/s). Exclusion criteria were the following: CRI patients of post-renal etiology (e.g., hydronephrosis); patients with autosomal dominant polycystic kidney disease; patients with acute CRI; and patients with terminal renal insufficiency undergoing dialysis. Ultimately, 54 patients with a CRI diagnosis, undergoing clinical follow-up with serum creatinine collected over the previous 90 days were referred for routine renal US. The scans were independently performed by two blinded radiologists in a M2540A Envisor Ultrasound system (Philips Ultrasound; Bothell, WA, USA) using B-mode imaging (gray scale). The renal cortical layer thickness was measured in the sagittal plane, above the medullary pyramid, perpendicularly to the capsule, in the upper and middle thirds of the kidney. The bipolar length was measured from the upper to the lower pole, in the sagittal plane. The parenchymal thickness was measured either on the upper or lower pole, depending on the degree of visualization (Figure 1). 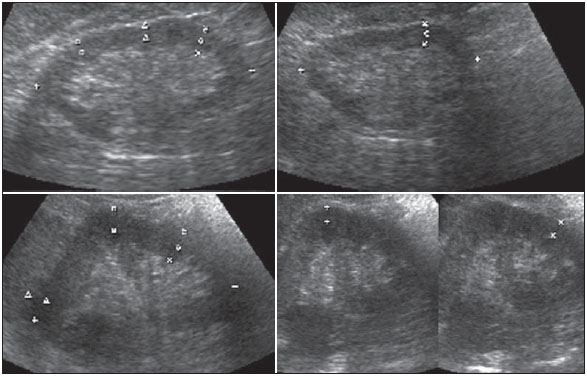 Figure 1. Sonographic images describing how renal cortex and parenchyma thicknesses as well as bipolar length were obtained. In this analysis, the authors considered the measurements performed in the left kidney because it is usually larger than the right kidney due its positioning and to differences in vascularization (the left renal artery is shorter, providing a greater blood supply), while the left kidney is free from extrinsic compressions, making its measurements more reliable(6). The results of the serum creatinine test performed over the previous 90 days and were used to estimate the GFR using the Cockcroft-Gault equation that is commonly used in the clinical practice. A recent study correlating 24-hour urine creatinine clearance (gold standard) with the several clearance estimation formulas shows that the Cockcroft-Gault equation is the best predictor of GFR for both CRI and healthy patients(7,8). Statistical analysis All the collected data were initially analyzed using descriptive statistics. Some summary statistics such as mean, median, minimum and maximum values and standard deviation (SD) were calculated, and unidimensional and two-dimensional scatter diagram-type charts were prepared. The interobserver agreement in relation to cortical thickness, parenchymal thickness, and bipolar length measurements, was initially analyzed by means of Bland-Altman plots and, subsequently, by estimating the intraclass correlation coefficient (ICC)(9). The Pearson's linear correlation coefficient was utilized to analyze the correlation between estimated renal function and cortical thickness, parenchymal thickness, and bipolar length(9). Statistical significance corresponded to p value < 0.05. The data were entered into Windows Excel 2010 worksheets. Statistical analyses were performed using the Statistical Package for the Social Sciences 17.0 for Windows, and the R-Program, version 2.11.1. RESULTS Distribution and characteristics of the study population The sample of cases of this study included 54 individuals, 20 (37.0%) women, and 34 (63.0%) men. The mean age was 64.4 years (range, 22-87 years; SD = 12.3 years). The average weight was 79.9 kg (range, 49-137 kg; SD = 17.2 kg). The average level of creatinine was 2.45 mg/dL (range, 0.8-6.10 mg/dL; SD = 1.37 mg/dL). Average renal function as measured by the Cockcroft-Gault equation was 37.99 mL/min (range, 10-120 mL/min; SD = 21.05 mL/min). Average cortical thickness was 0.68 cm in the upper third (range, 0.38-1.36 cm; SD = 0.19 cm), and 0.71 cm in the middle third of the left kidney (range, 0.37-1.18 cm; SD = 0.19 cm); average parenchymal thickness was 1.35 cm (range, 2.06-0.73 cm; SD = 0.30 cm), and the average bipolar length was 9.5 cm (range, 6.99-13 cm; SD = 1.25 cm). Concerning the distribution of the 54 patients in relation to the five CRI levels, 8 (15%) were level I/II, 25 (46%) level III, 15 (28%) level IV, and 6 (11%) level V. Method reproducibility Initially, the authors analyzed the interobserver agreement regarding the quantitative measurements. The ICC indicated satisfactory and excellent interobserver agreement, with best results for cortical thickness and bipolar length (Table 1). 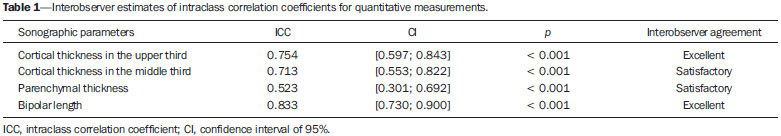 Correlation between renal measurements and estimated renal function impairment Pearson's linear correlation coefficient (r) showed moderate correlation between measurements of cortical thickness (r = 0.449-0.478; p < 0.001) and renal function impairment. However, poor but still significant correlation was observed between renal function and bipolar length (r = 0.380; p = 0.004) (Table 2; Figure 2). Finally, the correlation between estimated renal function impairment and parenchymal thickness proved to be poor and without any statistical significance (r = 0.217; p = 0.116). 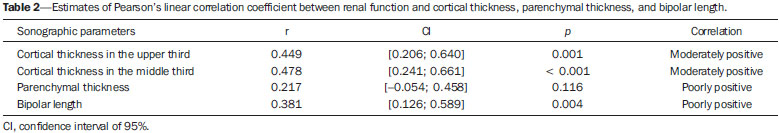 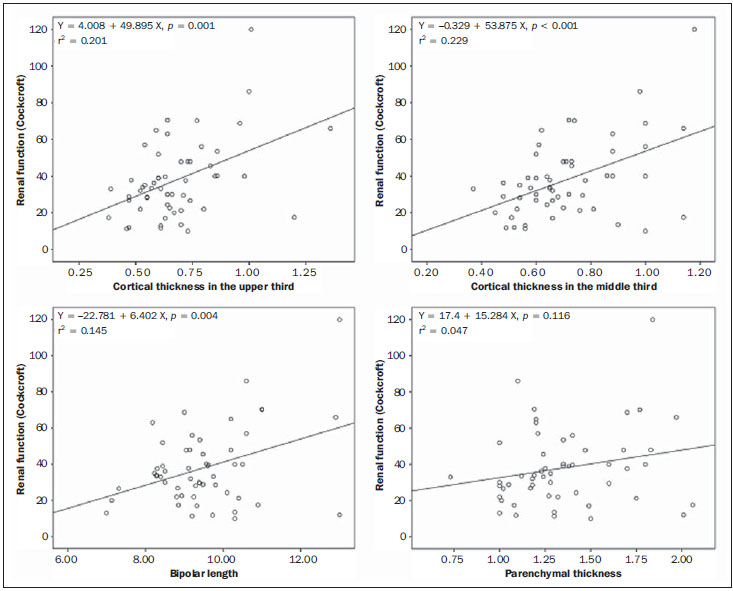 Figure 2. Distribution of renal function impairment levels according to cortical thickness, bipolar length and parenchymal thickness of the left kidney. DISCUSSION Beland et al. have suggested that cortical thickness would be a good indicator for renal function impairment as they could demonstrate a statistically significant linear relationship and a strong correlation (r2 = 0.66) between cortical thickness and renal function(3). However, their study presented some limitations, including the small sample size (n = 25) and the retrospective consensual analysis of previously acquired imaging files. The authors themselves have suggested that further studies would be required to either confirm or invalidate their findings, which provided the motivation for the present study. Thus, the present study was aimed at reproducing and confirm their findings using a larger sample, in a prospective analysis with direct and real-time evaluation by the observers. Additionally, the value and reproducibility of parenchymal thickness measurement were also evaluated. The results of the present study demonstrate that the renal function status can be indirectly estimated by means of renal cortex measurements in the upper and middle third of the left kidney. Also, the bipolar length of the left kidney could serve as an indirect estimate of renal function impairment, but with less significant results. On the other hand, estimated renal function and parenchymal thickness have proved to be only weakly and non-significantly correlated; thus, parenchymal thickness should not be used as an indirect indicator of renal function impairment. In other words, the measurement of the thickness of the renal parenchyma, which is still widely used in the clinical practice to infer some chronic nephropathies, should be discouraged since it showed no statistical correlation with renal function impairment and therefore it is useless in this context. It is known that glomeruli are found in the renal cortex and columns of Bertin, and renal tubules, in the medullary pyramids. The progressive renal function impairment affects the glomeruli which frequently results in tapering of the renal cortex and of columns of Bertin, so that the kidney presents with tapered, lobulated contours in association with increased presence of fat in the renal sinus, indicating chronic nephropathy(10). Even with these changes, however, the bipolar length and parenchymal thickness may still be within the curve of normality. So, many times one may conclude that the kidneys do not present any significant abnormality and the natural progression of nephropathy is missed - hence the relevance of a parameter such as cortical thickness as a possible predictor of CKD and its potential value in the evaluation of the CRI progression. Although this potential has been studied, the results are still not unequivocal. Some authors report that renal cortex thinning occurs in ischemic nephropathy, so the cortical thickness should be measured whenever possible(11). However, an exception should be made in the case of diabetic kidney disease, as nephromegaly, characterized by hypertrophy, affects all components and, in some cases, measurements, including cortical thickness, remain normal until the final stage of CRI is present(12). On the other hand, it should be remembered that up to 20% of diabetic patients have renal failure resulting from causes not directly related to the disease. For example, renal artery stenosis is three times more frequent in diabetic patients. Vascular diseases affecting the microvasculature (hypertensive nephrosclerosis) or the renal macrovasculature (ischemic renal disease) represent other possible causes of CRI in this group of patients and, as previously mentioned, these diseases also cause renal cortex thinning(11). The present study has identified moderate linear correlation between cortical thickness and estimated renal function, but it was lower than that reported by Beland et al., although still significant. A possible reason for such a result may be related to the fact that the Brazilian population with CRI predominantly consists of hypertensive and diabetic patients, resulting in a combination of ischemic nephropathy that theoretically causes renal cortex thinning but is counterbalanced by diabetic nephropathy (in association with nephromegaly) that preserves this region. As expected, the measurement of renal length presented poor correlation with renal function. This is explained by the fact that renal length varies with the height of the individual and tends to decrease after the age of 50, when the kidneys becomes wider(12). On the other hand, the measurement of renal volume has not presented better results in terms of correlation with renal function(12). In the present study, the authors did not evaluate the correlation between such an index and renal function. Studies in the literature indicate that both the cortex and the renal pyramid decrease in parallel(10). Considering that discerning pyramids may represent a challenge, the measurement of cortical thickness would, theoretically, be a more reliable indicator, if the measurement reproducibility could be demonstrated. The results of the present study demonstrated excellent/good interobserver agreement in relation to cortical thickness measurement on the left kidney, making this parameter very reliable. In contrast, a poor correlation was observed between parenchymal thickness and renal function impairment, with no statistical significance. This measurement thus seems to have no practical value in the evaluation of the level of renal function impairment in CRI patients. The present study presents some limitations. Because it is a cross-sectional study, a follow-up of the measurements was not performed, so the progressive renal cortex thinning resulting from the glomerular filtration deterioration could not be observed. On the other hand, by considering the distribution of patients according five levels of renal function impairment, the authors expected to partially neutralize this limitation. Also, a healthy control group was not studied for comparison. However, by including 15% of patients with CRI level I/II (i.e., with GFR considered within normality standards), the authors have partially mitigated this bias. Finally, it was not possible to establish a cutoff point for cortical thickness corresponding to compromised renal function. In this sense, the continuation of this research will involve the development of a case-control study to evaluate the possibility of establishing a cutoff value for renal cortical measurement, with appropriate values of sensitivity and specificity to infer the presence of CRI in patients submitted to US for diverse reasons. Finally, the comparison between renal US images and GFR of CRI patients indicates a good interobserver reproducibility of renal measurements. Additionally, the authors have identified a moderate linear correlation between estimated GFR and renal cortex thickness; and a poor correlation between renal function impairment and bipolar length or parenchymal thickness. Acknowledgements The authors wish to thank Andrea Puchnick for her assistance in the preparation of this manuscript. REFERENCES 1. Lederer E, Ouseph R. Chronic kidney disease. Am J Kidney Dis. 2007;49:162-71. 2. Kariyanna SS, Light RP, Agarwal R. A longitudinal study of kidney structure and function in adults. Nephrol Dial Transplant. 2010;25:1120-6. 3. Beland MD, Walle NL, Machan JT, et al. Renal cortical thickness measured at ultrasound: is it better than renal length as an indicator of renal function in chronic kidney disease? AJR Am J Roentgenol. 2010;195:W146-9. 4. Emamian SA, Nielsen MB, Pedersen JF, et al. Kidney dimensions at sonography: correlation with age, sex, and habitus in 665 adult volunteers. AJR Am J Roentgenol. 1993;160:83-6. 5. Raj DS, Hoisala R, Somiah S, et al. Quantitation of change in the medullary compartment in renal allograft by ultrasound. J Clin Ultrasound. 1997;25:265-9. 6. Tarzamni MK, Nezami N, Rashid RJ, et al. Anatomical differences in the right and left renal arterial patterns. Folia Morphol (Warsz). 2008;67:104-10. 7. Cockcroft DW, Gault MH. Prediction of creatinine clearance from serum creatinine. Nephron. 1976;16:31-41. 8. Sanusi AA, Akinsola A, Ajayi AA. Creatinine clearance estimation from serum creatinine values: evaluation and comparison of five prediction formulae in Nigerian patients. Afr J Med Med Sci. 2000;29:7-11. 9. Fleiss JL. Statistical methods for rates and proportions. New York, NY: John Wiley & Sons; 1973. 10. Buturovic-Ponikvar J, Visnar-Perovic A. Ultrasonography in chronic renal failure. Eur J Radiol. 2003;46:115-22. 11. O'Neill WC. Sonographic evaluation of renal failure. Am J Kidney Dis. 2000;35:1021-38. 12. Sanusi AA, Arogundade FA, Famurewa OC, et al. Relationship of ultrasonographically determined kidney volume with measured GFR, calculated creatinine clearance and other parameters in chronic kidney disease (CKD). Nephrol Dial Transplant. 2009;24:1690-4. 1. MD, Radiologist, Collaborator at Unit of Radiology and Imaging Diagnosis, Escola Paulista de Medicina da Universidade Federal de São Paulo (EPM-Unifesp), São Paulo, SP, Brazil 2. PhD, Radiologist, Collaborator at Department of Imaging Diagnosis, Escola Paulista de Medicina da Universidade Federal de São Paulo (EPM-Unifesp), São Paulo, SP, Assistant Professor at Universidade do Vale do Sapucaí (Univás), Pouso Alegre, MG, Brazil 3. PhD, Research Physician Assistant, Department of Imaging Diagnosis, Escola Paulista de Medicina da Universidade Federal de São Paulo (EPM-Unifesp) and Centro Cochrane do Brasil, São Paulo, SP, Brazil 4. PhD, Associate Professor of Imaging Sciences, Universidade de Brasília (UnB), Brasília, DF, Brazil 5. PhD in Nephrology, Escola Paulista de Medicina da Universidade Federal de São Paulo (EPM-Unifesp), São Paulo, SP, Brazil 6. PhD, Associate Professor, Division of Nephrology, Escola Paulista de Medicina da Universidade Federal de São Paulo (EPM-Unifesp), São Paulo, SP, Brazil 7. Private Docent, Unit of Radiology and Imaging Diagnosis, Escola Paulista de Medicina da Universidade Federal de São Paulo (EPM-Unifesp) and Laboratório Fleury, São Paulo, SP, Brazil Mailing Address: Dr. Wagner Iared Rua Napoleão de Barros, 800, Vila Clementino São Paulo, SP, Brazil, 04024-002 E-mail: wagneriared@gmail.com Received February 9, 2014. Accepted after revision June 6, 2014. Study developed at Department of Imaging Diagnosis and at Division of Nephrology, Escola Paulista de Medicina da Universidade Federal de São Paulo (EPMUnifesp), São Paulo, SP, Brazil. |
|
Av. Paulista, 37 - 7° andar - Conj. 71 - CEP 01311-902 - São Paulo - SP - Brazil - Phone: (11) 3372-4544 - Fax: (11) 3372-4554