Radiologia Brasileira - Publicação Científica Oficial do Colégio Brasileiro de Radiologia
AMB - Associação Médica Brasileira CNA - Comissão Nacional de Acreditação
 Vol. 47 nº 4 - July / Aug. of 2014
|
REVIEW ARTICLE
|
|
Imaging of the adrenal gland lesions |
|
|
Autho(rs): Keith Herr1; Valdair F. Muglia2; Walter José Koff3; Antonio Carlos Westphalen4 |
|
|
Keywords: Adrenal gland; Adenoma; Cancer; Diagnosis; Radiology. |
|
|
Abstract: INTRODUCTION
Imaging and management of adrenal gland pathology has been the subject of intense research and controversy in the past 25 years, in tandem with the increasing use of cross-sectional imaging as a fundamental component of modern medical care. Except where adrenal pathology is specifically implicated, such as in the setting of unexplained hypertension or Cushing's syndrome, the discovery of an adrenal lesion is usually incidental during the imaging work-up of unrelated diseases. Autopsy studies document a prevalence of incidentally discovered adrenal masses, or "incidentalomas", of around 6%, approximating the reported prevalence of 4% at computed tomography (CT)(1,2). The prevalence, however, increases with age, from 1% of individuals less than 30 years to 7% over age 70(1). Overall, approximately 75% of incidentalomas represent nonfunctioning adenomas(3), yet a high proportion, up to 40–60%, will represent metastatic disease in the oncologic population(4,5). Distinguishing benign from malignant adrenal disease is essential, as an accurate diagnosis will inform management, which can entail doing nothing, performing further investigation, or instituting definite local and/or systemic therapy. Adrenal imaging has undergone significant evolution in the past decades as new techniques and technologies are being applied to adrenal disease work-up. In this review, we will discuss in detail the characterization of adrenal lesions with an emphasis on computed tomography (CT), magnetic resonance imaging (MRI) and positron-emission tomography (PET). Recent advances in nuclear medicine, contrast-enhanced ultrasound (CEU), dual-energy CT, and MR spectroscopic imaging will also be briefly addressed. BENIGN LESIONS Adrenal adenoma Although the differential diagnosis of an incidentally discovered adrenal mass is broad, it is statistically most likely to represent an adenoma(6). Thus, it behooves the radiologist to prove a lesion is an adenoma whenever possible and can be dismissed as such. Frequently, however, an adrenal mass cannot be fully characterized at the time of initial imaging. Architectural features, such as size, shape and homogeneity, can be helpful in suggesting a diagnosis, but these features alone are frequently not definitive. Of these features, size is particularly important: smaller adrenal lesions tend to be benign and larger ones are more likely malignant(6–10). Recently, the American College of Radiology analyzed the available data and recommended that incidental nodules measuring < 1 cm can be ignored, indeterminate nodules measuring between 1 cm and 4 cm need further assessment or follow-up to establish stability, and lesions measuring > 4 cm should undergo biopsy or PET(6). These recommendations are summarized in Figure 1. Size stability over a period of 12 months confers benignity and comparison with any available prior imaging should be pursued to avoid unnecessary additional testing. Although adenomas can rarely grow(11), any change in size should prompt additional investigation(12). 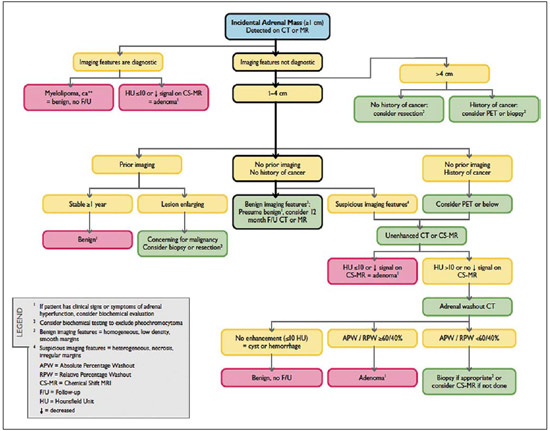 Figure 1. Algorithm for the assessment of an incidental adrenal lesion detected on CT or MRI. (With permission from the American College of Radiology, from Managing incidental findings on abdominal CT: white paper of the ACR incidental findings committee. J Am Coll Radiol. 2010;7:754–73). Most adrenal adenomas contain intracellular lipid, which serves as a precursor of adrenal cortical hormones. Identification of abundant microscopic lipid on imaging studies is sufficient to exclude malignancy in nearly all cases of incidentalomas. Although several attenuation thresholds have been proposed to diagnose an adenoma on the basis of the presence of intracellular lipid, in clinical practice a cut-off of 10 Hounsfield units (HU) is most often used. A solid adrenal mass that clearly does not harbor macroscopic fat and has a density of 10 HU or less on unenhanced CT is considered to be an adenoma (Figure 2). This threshold has a specificity of 100% and a sensitivity of approximately 75%(6,10,13). To measure the attenuation, a region of interest should cover 1/2 to 2/3 of the lesion on an axial image, avoiding areas of necrosis or calcification(12). 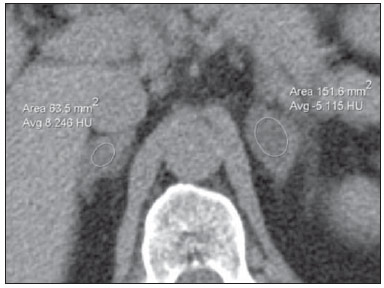 Figure 2. Bilateral adrenal adenomas. A region of interest drawn over each adrenal mass measures less than 10 HU, indicative of lipid-rich adenoma. The relatively low sensitivity of unenhanced CT is explained by the fact that only approximately 70% of adrenal adenomas contain sufficient intracellular lipid to be readily apparent as measuring < 10 HU(14). For these indeterminate lesions, intravenous contrast can be used in an attempt to characterize an adenoma based on contrast dynamics, or "washout." This is based on the observation that benign adrenal lesions "washout" more rapidly than primary adrenal malignancies or adrenal metastases(6,9,15,16). The combined assessment of unenhanced images and portal venous (PV, 60 to 90 seconds delay) and delayed (DP, typically 10 to 15 minutes delay) phase images allows for the calculation of the absolute percent washout (APW). The APW is derived from the formula: [(density on PV – density on DP / density on PV – density on non-contrast) × 100%]. The greater the washout, the more likely the lesion is benign, with a generally accepted threshold of > 60% taken to represent benign pathology(6,15,17). If an adrenal mass is detected during the acquisition of a standard post-contrast study for some other indication without initial unenhanced images, delayed images can be subsequently obtained and the relative percent washout (RPW) calculated using the formula: (density on PV – density on DP / density on PV). RPW values > 40% are generally taken to represent benign lesions; however, some investigators have demonstrated acceptable accuracy using a 50% cutoff value(6,15,17,18) (Figure 3). Although several time delay points have been proposed, usually a 10- or 15-minute delay is employed for purposes of calculating percent washout. Using a small sample size of 61 patients, Kamiyama et al. demonstrated 100% specificity in discriminating lipid-poor adenomas from non-adenomas using a 5-minute delay and a 48% threshold for absolute washout and 35% threshold for relative washout with sensitivity or 78% and 74%, respectively. If replicated, these findings suggest that a shorter delay may be used without sacrificing accuracy. Online calculators are readily available to calculate percent washout at the time of interpretation (see, for example, http://www.chestx-ray.com/index.php/calculators/adrenal-characterization)(19).  Figure 3. Incidental adrenal nodule identified on previous CT scan performed for abdominal pain (arrows). A region of interest drawn over an adrenal nodule demonstrated a density of 13 HU on unenhanced CT (A), 80 HU on portal venous phase (B), and 36 HU on the 12-minute delayed phase (C), corresponding to a relative washout of 55% and an absolute washout of 66%. Findings are diagnostic of an adenoma. The presence of intracellular lipid in adrenal adenomas can also be detected with chemical shift MRI. The chemical shift phenomenon relies on the differential precession frequencies of protons in lipid and water within the same imaging voxel. These protons precess "in-phase" at an echo time of 4.2 milliseconds at 1.5 tesla, with a resulting summation signal, but in opposite directions, or "out-of-phase", at an echo time of 2.1 milliseconds, resulting in a net cancellation of signal(20). A lipid-rich adenoma, accordingly, will lose signal on out-of-phase images relative to its in-phase signal intensity as well as to reference organs that do not contain microscopic fat (Figure 4). Both quantitative and qualitative methods of assessing signal change in adrenal lesions between in-phase and out-of-phase imaging appear to be equally effective in discriminating adrenal adenomas from metastases, with the adrenal-to-spleen ratio demonstrating the best performance among the quantitative techniques, including adrenal-tomuscle and adrenal-to-liver ratios in a study by Mayo-Smith et al.(21). The accuracy of chemical shift MRI in adrenal lesion characterization is similar to that of CT; however, MRI may be particularly useful in characterizing indeterminate adrenal nodules with an unenhanced CT attenuation between 10 and 30 HU, whereas washout pattern on contrast-enhanced CT may be more informative for characterization of nodules with attenuation values greater than 30 HU(22–24). 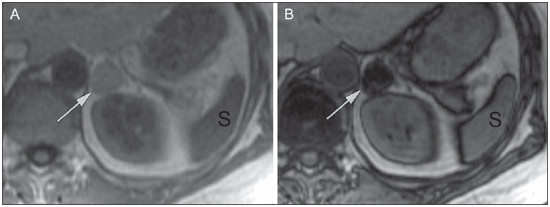 Figure 4. Incidental adrenal nodule identified on previous CT scan performed for staging of colon cancer (arrows). The nodule has high signal intensity relative to the spleen on in-phase MR images (A), but this relationship reverses on opposed-phase MR images, as it loses signal from microscopic lipid (B). Findings are diagnostic of a lipid-rich adenoma. S, spleen. In contradistinction to the extensive data supporting the use of chemical shift MRI in distinguishing benign from malignant adrenal lesions, there has been limited experience with the use of dynamic contrast enhancement MRI for this purpose. While the observation that benign adrenal lesions tend to rapidly accumulate and wash out gadolinium appears constant, there are no established dynamic enhancement characteristics that have proven conclusive and, at present, the use of dynamic contrast-enhanced MRI in the assessment of adrenal pathology has not gained widespread acceptance(25–27). Myelolipoma Adrenal myelolipoma is a rare neoplasm comprised of macroscopic fat and hematopoietic elements. Prevalence at autopsy is 0.08–0.4%(28). This entity rarely presents a diagnostic challenge at imaging, as the macroscopic fat-content of these tumors is readily apparent as foci of fat-attenuation on CT, with density measurements usually yielding values less than –30 HU, or loss of signal on fat-saturated MRI (Figure 5). Lipomas and liposarcomas remain in the differential diagnosis of such masses; however, a primary adrenal location for these tumors is exceedingly rare. Pheochromocytomas rarely undergo lipid degeneration and may have foci of fat-attenuation on CT, but this entity can normally be distinguished from myelolipoma on a clinical basis(29).  Figure 5. Myelolipoma (arrows). CT demonstrates macroscopic fat-attenuation within the mass (A). On MR imaging, macroscopic fat is characterized by signal loss on fat-suppressed T1-weighted MR images (B, without fat-saturation; C, with fat-saturation, post-contrast). Adrenal cyst/infection Adrenal cystic lesions account for only about 6% of incidentally detected adrenal lesions(30). Endothelial cysts account for the majority (45%), followed by pseudocysts from prior infection or trauma (39%), and parasitic infection, usually echinococcal in origin (7%)(30). True cysts and pseudocysts have liquid contents, and can be recognized as homogenously near-water attenuation lesions on non-enhanced CT, unless complicated by hemorrhage, which results in an increase in attenuation. A sedimentation level from layering blood products in a hemorrhagic cyst may also be seen, as can peripheral calcification and septations(28). Most of the uncomplicated cysts have a density in the range of 0 to 10 HU on both pre- and post contrast scans. Although enhancement of the lining of a cyst can occur, the presence of internal enhancement would not be expected; therefore, it may be difficult to distinguish a cyst from an adenoma on non-enhanced CT scans, as density values overlap. Nonetheless, this is not a clinical conundrum, as both are benign lesions and, if differentiation is necessary, a definitive diagnosis can be made with ultrasound or MRI. On MRI, an uncomplicated cyst will have homogeneous low signal intensity on T1-weighted images and high signal intensity on T2-weighted images (Figure 6). A hemorrhagic adrenal cyst may demonstrate increased T1 signal from extracellular methemoglobin. Incidental cystic lesions can usually be managed conservatively. Percutaneous aspiration may be indicated if there is concern for liquefaction necrosis of an underlying malignancy or if the cyst is larger than 6 cm, thick-walled or symptomatic(28,30).  Figure 6. Adrenal cyst. A small unilocular cyst is identified in the left adrenal gland (arrows). Low signal intensity on T1-weighted images (A), high signal intensity on T2-weighted images (B) similar to the cerebrospinal fluid, and lack of enhancement following the intravenous administration of gadolinium (C) are typical features. Infection of the adrenal gland by the Echinococcus granulosus parasite may result in cyst formation, referred to as a hydatid cyst. Imaging features depend on the stage of infection, and may be purely cystic, septated with daughter cysts, or even solid. Calcification is a variable finding(28). The prevalence of adrenal tuberculosis is not known; however, it is one of the leading causes of primary adrenal insufficiency in the developing world(31,32). Imaging findings depend on the phase of infection. Typical features include unilateral or bilateral enlarged, heterogeneously enhancing adrenal glands, with areas of necrosis in active disease, and calcification in late or resolving infection(32,33). Tissue analysis is required to confirm the diagnosis, but treatment is often started empirically, supported by clinical findings of tuberculosis or positive skin testing(31). Two of the most important differential considerations for adrenal tuberculosis, particularly in southern regions of South America, are histoplasmosis and paracoccidioidomycosis. The typical clinical profile of these infections is a young male with a rural occupational exposure to Histoplasma capsulatum or Paracoccidioides brasiliensis presenting with cough and other flu-like symptoms. Adrenal involvement tends to be asymptomatic, but as in adrenal tuberculosis, can lead to adrenal insufficiency if there is extensive bilateral involvement. Imaging findings are indistinguishable from those of adrenal tuberculosis (Figure 7)(31,34). 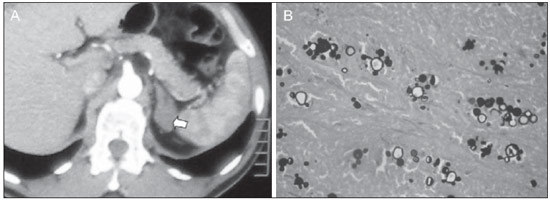 Figure 7. Paracoccidiomycosis. A heterogeneously enhancing adrenal mass is depicted (arrow in A). Paracoccidioides brasiliensis yeast cells in the adrenal gland of a patient with adrenal insufficiency (B) (100× magnification, GMS stain). (With permission from the Instituto de Medicina Tropical de São Paulo, from Identification of Paracoccidioides brasiliensis in adrenal glands biopsies of two patients with paracoccidiomycosis and adrenal insufficiency. Rev Inst Med Trop S Paulo. 2009;51:45–8). Hemorrhage Adrenal hemorrhage can be seen in the setting of trauma, coagulopathy and sepsis, or may be iatrogenic following surgery or adrenal venography(35,36). Adrenal hemorrhage following trauma is commonly associated with other forms of extra-adrenal injury and should, therefore, prompt careful inspection for additional, potentially life-threatening, intra-abdominal injuries(37). The CT appearance of adrenal hemorrhage is diverse and in the acute phase includes a focal high-attenuation hematoma, a heterogeneous and indistinct or enlarged adrenal gland, and periadrenal infiltration (Figure 8). A non-enhancing, calcified mass, hemorrhagic pseudocyst or adrenal gland atrophy is seen in chronic hemorrhage, and complete resolution is not uncommon(35–37). A T1-hyperintense mass would be an expected MR finding(35). 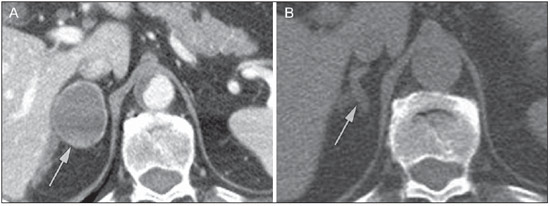 Figure 8. Hematoma. A: A focal, non-enhancing, homogenous right adrenal mass measuring greater than water attenuation (30 HU) on contrast-enhanced CT in a patient with Merkel cell carcinoma as part of PET-CT examination for surveillance (arrow). PET portion demonstrated a corresponding area of photopenia (not shown). B: An unenhanced CT scan performed three months earlier demonstrates a normal right adrenal gland (arrow). Isolated adrenal hemorrhage is of no clinical significance per se, but when bilateral, adrenal insufficiency may occur, which can precipitate a medical emergency(37). Pheochromocytoma Pheochromocytoma is a catecholamine-secreting neuroendocrine tumor of the adrenal medulla; in 10% of cases, however, it is found along the sympathetic chain, and as such is termed paraganglioma(29). Annual incidence is 0.8/100,000, accounts for 0.6% of patients with hypertension, and represents up to 5% of incidentally discovered nodules. Bilateral adrenal involvement occurs in 10% of sporadic cases, but nearing 80% in familial variants, which account for 30% of cases(14,38). Because of variable imaging features, pheochromocytomas mimic benign and malignant lesions on cross-sectional imaging, and are accordingly familiar to radiologist as "chameleon tumors". As mentioned above, pheochromocytomas can be confused with adenomas when intracellular lipid is present(39). In addition, they can follow the rapid washout pattern characteristic of adenomas(16,23,29). Size may be an important discriminating feature, as pheochromocytomas tend to be larger than adenomas (5–6 cm versus 1–3 cm)(14). Pheochromocytomas can be solid, solid and cystic, or purely cystic. When solid components are present, they usually enhance avidly. Alternatively, they can be homogeneous or show areas of central hemorrhage, necrosis or calcification(14,29). About two-thirds have intermediate to high signal on T2-weighted MRI, while the remaining demonstrate low signal intensity (Figure 9)(23). The classic "light bulb bright" T2 appearance of pheochromocytomas, however, is appreciated in only about 30% of cases(14). 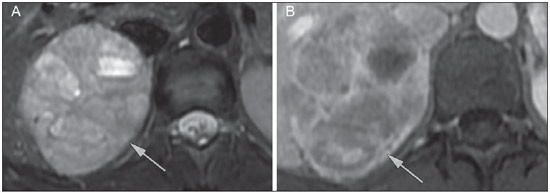 Figure 9. Pheochromocytoma (arrows). A large, heterogeneous adrenal mass on a T2-weighted MR image (A). Cystic and solid enhancing components are depicted in a post-contrast MR image (B). Elevated serum catecholamines were detected in this patient with pheochromocytoma. Given the challenges in diagnosing pheochromocytomas with CT or MRI, nuclear medicine is often indicated, with confirmation with metabolic work-up, as the majority are associated with elevated serum and urinary metanephrines(14). Imaging with 123-I metaiodobenzylguanidine (MIBG) has a sensitivity and specificity for pheochromocytoma of 83–100% and 95–100%, respectively (Figure 10)(14). Most pheochromocytomas are also 18-F fluorodeoxyglucose (FDG)-avid, particularly when malignant. One in ten pheochromocytomas will prove to be malignant, with metastatic disease to bone, lymph nodes, lung and liver possibly being the only reliable imaging findings(14). 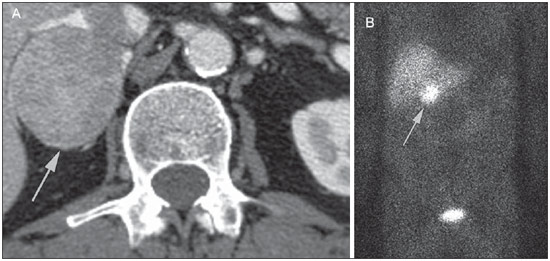 Figure 10. Pheochromocytoma (arrows). A contrast-enhanced CT image demonstrates a somewhat heterogeneously enhancing adrenal mass (A). Focal increased radiotracer uptake (B) corresponding to the adrenal mass in (A) on coronal 123-I MIBG scintigraphy. Physiologic radiotracer activity in the liver and excretion in the urinary bladder are noted. Ganglioneuroma Ganglioneuroma is a rare, benign neoplasm consisting of mature Schwann cells, ganglion cells and nerve fibers, arising from the retroperitoneal sympathetic chain ganglia or adrenal gland(40). Ganglioneuromas most commonly affect children and young adults and are usually asymptomatic, even when large. Only rarely are they hormonally active. On non-contrast CT, a well-circumscribed, homogeneous mass is typical. Calcifications are seen in 20% of cases and the enhancement pattern is variable. On MRI, low T1-and variable T2-weighted signal is seen(28,40). The prognosis of ganglioneuroma is excellent following surgical resection, and recurrence is rare(40). MALIGNANT LESIONS Adrenocortical carcinoma Adrenocortical carcinoma (ACC) is rare, with a prevalence of 1–2/million worldwide, and has a bimodal age distribution, with the first peak in childhood and the second peak in the fourth to fifth decade(41). An association with cancer syndromes, such as Li-Fraumeni and Beckwith-Wiedemann syndromes in children, as well as with familial adenomatous polyposis coli, has been described(42,43). A 10–15-fold higher annual incidence of ACC has been reported in children in southern Brazil when compared to children ≤ 15 years old in the United States due to a point mutation in the p53 tumor suppressor gene(43). The clinical presentation of ACC is variable. Approximately 60% of patients have clinically apparent overproduction of adrenal cortical hormone, such as androgens, estrogen and aldosterone, accounting for its diverse clinical presentation(41). In many of the clinically silent patients, however, serum adrenal cortical steroid precursors are nonetheless detectable(41). ACC is often large at initial imaging, typically measuring more than 4 cm in size and up to 25 cm. Irregular margins, necrosis, hemorrhage, calcifications, heterogeneous enhancement, local invasion, and vascular invasion are also commonly identified (Figure 11)(42). Attenuation on non-contrast CT is not useful in characterizing ACC, but heterogeneous enhancement is typical(16,44). Furthermore, these tumors show relatively slow washout of contrast, as seen in other non-adenoma adrenal masses(16). On T1-weighted MRI, ACC is usually iso- to slightly hypointense to liver(41,42). Regions of increased T1 signal can be seen due to intratumoral hemorrhage. On T2-weighted images, ACC is usually hyperintense to liver with heterogeneous signal in areas of hemorrhage and necrosis(42). Focal areas of signal loss can be seen on chemical shift MRI from intracytoplasmic cortisol and lipid-based hormone precursors; however, the pattern of signal loss on out-of-phase imaging is expected to be in homogeneous, unlike that seen in cortical adenomas(44). MRI is superior to CT for the depiction of invasion into adjacent structures and venous involvement(41,42). FDG-PET and PET/CT may be used to detect metastatic disease from ACC(41). 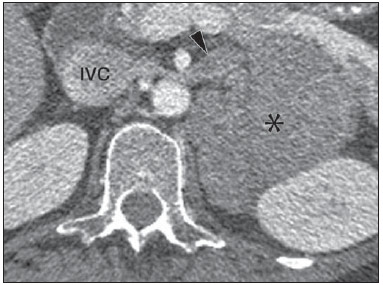 Figure 11. Adrenocortical carcinoma. A heterogeneously enhancing adrenal mass (asterisk) is demonstrated, which displaces the ipsilateral kidney laterally. This mass was diagnosed as adrenocortical carcinoma at biopsy. Note invasion of the left renal vein (arrowhead). IVC, inferior vena cava. The mainstay of treatment of ACC is surgery, even in advanced disease with metastases, and for recurrence, seen in 85% of patients(41). Mitotane, an adrenocortical-specific cytotoxic agent, has been shown to slow progression of disease in some studies(41). Despite treatment, the overall prognosis for ACC is exceptionally poor, with only a 16–38% 5-year survival rate, depending on stage. Imaging plays a crucial role in follow-up, and is more sensitive for the detection of recurrence and metastatic disease than hormone surveillance, with established utility in detecting hormonally inactive tumors(41). Lymphoma Primary adrenal lymphoma typically affects elderly men. Fever, weight loss, abdominal and/or back pain are common at the time of diagnosis, and many patients present with adrenal insufficiency(45). Secondary involvement of the adrenal gland occurs in 4% of cases of non-Hodgkin lymphoma at CT and 25% in post-mortem studies(46). It is usually seen in patients with multifocal disease with involvement of the ipsilateral kidney and retroperitoneum(46). Primary adrenal lymphoma is very rare, accounting for only 3% of extranodal primary lymphoma(47). The vast majority is large B-cell type(14,45,48). Primary adrenal lymphoma is indistinguishable from secondary adrenal lymphoma at imaging, and no single imaging feature is diagnostic for either condition. These lesions are typically large, often exceeding 10 cm, and homogeneous, with an attenuation similar to that of muscle(45). Enhancement is usually uniform and low-to-moderate in intensity. Heterogeneity owing to cystic change, necrosis or hemorrhage can occur. Involvement of the ipsilateral kidney and adjacent vessels is a frequently associated finding in more extensive disease. On MRI, adrenal lymphoma is typically T1-hypointense and T2-hyperintense to muscle. No signal loss is detected on chemical shift imaging(46). Experience with PET/CT in imaging of primary adrenal lymphoma is limited, but these tumors generally demonstrate FDG-avidity(49). Treatment for adrenal lymphoma include surgery, chemotherapy and radiation therapy; however, prognosis is poor, with an approximately 50% 1-year mortality owing to late presentation and additional poor prognostic factors, such as advanced age and extra-adrenal involvement(46). Neuroblastoma Neuroblastoma is a malignant neoplasm derived from the embryologic neural crest, and usually arises within the adrenal medulla but can present anywhere along the sympathetic chain ganglia(14). It is the most common solid extra-cranial neoplasm of childhood, with 50% seen in children younger than 2 years(14). Metastatic disease to the liver and/or bone is present in over 50% of cases at the time of diagnosis. Patients may present with hypertension, tachycardia or flushing from catecholamine excess(14). Classically, neuroblastomas are heterogeneous, necrotic or hemorrhagic masses that tend to engulf abdominal vessels (Figure 12). Calcifications are seen in 30% of cases. It is important to differentiate this entity from Wilm's tumor, or nephroblastoma, which arises from the kidney, occurs in slightly older children (> 2 years), rarely calcifies and tends to displace abdominal vasculature(14). MIBG scintigraphy and FDG-PET/CT are used in the diagnosis and staging of neuroblastoma, and 99m-Tc diphosphophonate bone scintigraphy is often used to detect bone metastases(14). 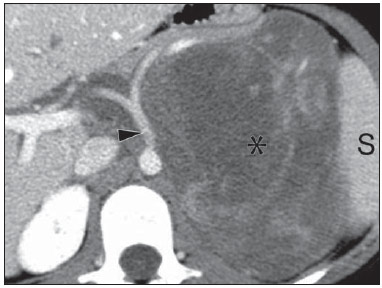 Figure 12. Neuroblastoma. A large, heterogeneously enhancing adrenal mass (asterisk) with encasement of the celiac axis (arrowhead) and other abdominal vessels is shown. Calcifications are common, but not present in this case. S, spleen. Metastasis Metastasis to the adrenal gland represents the second most common adrenal mass, after adenoma(50). The most common tumors to metastasize to the adrenal gland are lung (39%) and breast cancer (35%), with melanoma (Figure 13) and renal, colon, rectal and thyroid carcinomas making up the majority of the remaining primary malignancies(4,50). At autopsy, 10–27% of individuals with a primary malignancy have adrenal metastasis, and roughly 50% of adrenal masses identified on oncologic imaging represent metastatic disease(4,51). Adrenal metastases are bilateral in 10–50% of cases and usually occur in patients with widespread metastatic disease(4,51). Isolated adrenal metastases are rare, occurring in less than 1% of oncologic patients(52,53). 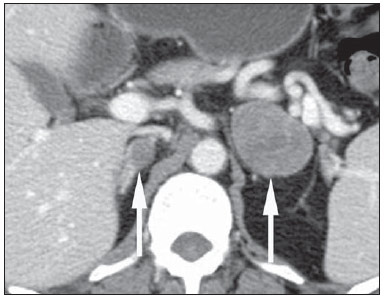 Figure 13. Melanoma metastases. Post-contrast image demonstrates bilateral adrenal masses (arrows). While the imaging features of these lesions are not specific, the bilateral distribution, size of the left-sided mass, and history of melanoma suggest the diagnosis. Features of adrenal metastasis include size greater than 4–6 cm, interval change in size, irregular shape and necrosis, and invasion of adjacent structures. The presence of these findings dramatically increases the likelihood of adrenal metastasis in patients with known extra-adrenal malignancy(50). Washout characteristics on CT and chemical-shift MRI are used in differentiating adrenal adenomas from malignancy, including metastases. Caution is advised in patients with hypervascular hepatocellular carcinoma and renal cell carcinoma, as adrenal metastases from these primaries may demonstrate the rapid washout dynamics usually seen in benign lesions(1,54). FDG-PET has notable utility in the evaluation of adrenal metastasis, with an overall sensitivity of 97% and specificity of 91% in one large meta-analysis(12). Normal adrenal glands are typically only weakly FDG-avid, while most malignancy demonstrates significantly greater FDG uptake than background(55,56). The combination of CT with or without contrast further improves the accuracy of PET (Figure 14)(12,56,57). False negative results may occur with hemorrhagic and necrotic tumors, benign and malignant pheochromocytoma, and hypometabolic cancers, such as carcinoid, adenocarcinoma in situ and renal cell carcinoma(56). Various inflammatory processes, e.g. tuberculosis and sarcoidosis, can cause false positive results(50). 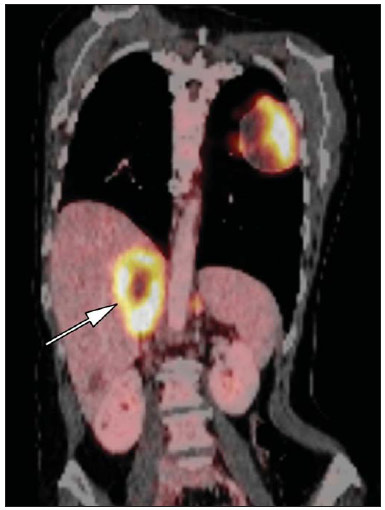 Figure 14. Lung cancer metastasis. Coronal fused FDG-PET/CT with a large, hypermetabolic right adrenal mass with central necrosis, indicative of metastatic disease (arrow) in this patient. PET/CT may be particularly useful in the detection of "collision tumors", in which malignancy occurs in or adjacent to a known pre-existing benign adrenal lesion, such as metastatic disease arising within an adrenal adenoma(57). Minor morphologic abnormalities Non-mass-like morphologic abnormalities of the adrenal gland are common, and include smooth enlargement and nodularity. These features may have clinical relevance in patients with endocrine abnormalities; however, any morphologic variation from a normal appearance could conceivably be viewed with concern in a patient with a known extra-adrenal malignancy, as the possibility of metastatic disease might be raised. The available data, however, demonstrate no association between minor morphologic changes and metastatic disease in this population, and these features alone should not raise a suspicion for metastatic adrenal involvement(58,59). FUTURE DIRECTIONS Advances in imaging technology, such as CEU, dual-energy CT, and MR spectroscopic imaging have recently been investigated for the characterization of adrenal lesions. Limited experience with CEU using phospholipid-stabilized microbubbles filled with sulfur hexafluoride reveals exquisite sensitivity (100%) for adrenal malignancy, but relatively poor specificity (67–82%)(60,61). The high sensitivity suggests that CEU may play a role in the work-up of incidentally discovered adrenal lesions, though further study is needed(61). In dual-energy CT, two image series are created at two different energies (often 80 and 140 kVp) nearly simultaneously, revealing information about tissue composition that is not demonstrable with single-energy acquisition. Preliminary data suggest that comparing non-contrast attenuation values at different energies is specific for adenomas; however, its relatively poor sensitivity currently limits clinical applicability(62). In addition, "virtual" non-enhanced images can be constructed by mathematically subtracting iodine from enhanced images, allowing for an unenhanced evaluation of adrenal nodules to identify lipid-rich adenomas(63). Early experience with virtual contrast-subtracted imaging suggests a high degree of accuracy in nodule characterization for lesions measuring > 1 cm, but further research is needed for confirmation(64). MR spectroscopic imaging has an established role in neuroradiology and has also been used with success to evaluate patients with prostate cancer(65,66). The technique allows for the characterization of the lipid and biochemical profile of living tissues and recent studies by Faria et al. suggest that it can also be used to characterize adrenal masses(67,68). In particular, MR spectroscopy could be used to distinguish adenomas, adrenocortical carcinoma, pheochromocytomas, and metastases based on the cholineto-creatine and lipid-to-creatine ratios. For example, a choline-to-creatine ratio less than 1.2 is most consistent with a diagnosis of an adenoma or pheochromocytoma rather than that of an adrenocortical carcinomas or metastasis. A lipid-to-creatine ratio of less than 2.1 then suggests the diagnosis of a pheochromocytoma. While these results are promising, new studies are necessary before MR spectroscopic imaging can be adopted into everyday practice. IMAGING PROTOCOLS Imaging protocols may vary slightly based on preferences of individual radiologists, and based on the equipment and software available at different institutions. Below we provide the MRI (Table 1) and CT protocols we use at our institution. Our adrenal gland CT protocol comprises of 1.25 mm axial slices through the abdomen prior to and after the intravenous administration of 100–150 ml of iodinated contrast at a rate of 3 ml/s. Post-contrast images are obtained at 90 seconds and 12 minutes delays. Source images of all phases are reconstructed on the axial plane at 5 mm, and on the sagittal and coronal planes at 3 mm. We make use of adaptive statistical iterative reconstruction with a blend level of 40%, energy is set at 120 kV, and the tube current is variable, ranging between 100–440 mA in most cases. The default field-of-view is 36 cm, but smaller or larger areas are used depending on patient size. CONCLUSIONS Adrenal gland imaging is occasionally indicated in the work-up of diseases of primary adrenal gland dysfunction; however, adrenal pathology is overwhelmingly discovered as an incidental finding in the investigation of unrelated conditions or as part of staging for malignancy. Accordingly, the imaging characterization of adrenal lesions has stimulated considerable research in the past few decades, which has allowed for an increasingly accurate assessment of adrenal pathology. Imaging using CT, MRI and nuclear medicine for differentiating benign and malignant adrenal disease enjoys widespread clinical use, and newer techniques, such as CEU, dual-energy CT and MR spectroscopy have demonstrated early promise as supplemental or problem-solving modalities. REFERENCES 1. Zeiger MA, Siegelman SS, Hamrahian AH. Medical and surgical evaluation and treatment of adrenal incidentalomas. J Clin Endocrinol Metab. 2011;96:2004–15. 2. Young WF Jr. Clinical practice. The incidentally discovered adrenal mass. N Engl J Med. 2007;356:601–10. 3. Song JH, Chaudhry FS, Mayo-Smith WW. The incidental adrenal mass on CT: prevalence of adrenal disease in 1,049 consecutive adrenal masses in patients with no known malignancy. AJR Am J Roentgenol. 2008;190:1163–8. 4. Lenert JT, Barnett CC Jr, Kudelka AP, et al. Evaluation and surgical resection of adrenal masses in patients with a history of extra-adrenal malignancy. Surgery. 2001;130:1060–7. 5. Lam KY, Lo CY. Metastatic tumours of the adrenal glands: a 30-year experience in a teaching hospital. Clin Endocrinol. 2002;56:95–101. 6. Berland LL, Silverman SG, Gore RM, et al. Managing incidental findings on abdominal CT: white paper of the ACR incidental findings committee. J Am Coll Radiol. 2010;7:754–73. 7. Blake MA, Kalra MK, Sweeney AT, et al. Distinguishing benign from malignant adrenal masses: multi-detector row CT protocol with 10-minute delay. Radiology. 2006;238:578–85. 8. Bulow B, Ahren B. Adrenal incidentaloma – experience of a standardized diagnostic programme in the Swedish prospective study. J Intern Med. 2002;252:239–46. 9. Choyke PL. ACR Appropriateness Criteria on incidentally discovered adrenal mass. J Am Coll Radiol. 2006;3:498–504. 10. Lee MJ, Hahn PF, Papanicolaou N, et al. Benign and malignant adrenal masses: CT distinction with attenuation coefficients, size, and observer analysis. Radiology. 1991;179:415–8. 11. Pantalone KM, Gopan T, Remer EM, et al. Change in adrenal mass size as a predictor of a malignant tumor. Endocrine Practice. 2010;16:577–87. 12. Boland GW. Adrenal imaging. Abdom Imaging. 2011;36:472–82. 13. Boland GW, Lee MJ, Gazelle GS, et al. Characterization of adrenal masses using unenhanced CT: an analysis of the CT literature. AJR Am J Roentgenol. 1998;171:201–4. 14. Low G, Dhliwayo H, Lomas DJ. Adrenal neoplasms. Clin Radiol. 2012;67:988–1000. 15. Caoili EM, Korobkin M, Francis IR, et al. Delayed enhanced CT of lipid-poor adrenal adenomas. AJR Am J Roentgenol. 2000;175:1411–5. 16. Szolar DH, Korobkin M, Reittner P, et al. Adrenocortical carcinomas and adrenal pheochromocytomas: mass and enhancement loss evaluation at delayed contrast-enhanced CT. Radiology. 2005;234:479–85. 17. Caoili EM, Korobkin M, Francis IR, et al. Adrenal masses: characterization with combined unenhanced and delayed enhanced CT. Radiology. 2002;222:629–33. 18. Pena CS, Boland GW, Hahn PF, et al. Characterization of indeterminate (lipid-poor) adrenal masses: use of washout characteristics at contrast-enhanced CT. Radiology. 2000;217:798–802. 19. DeVries M, Johnson C. Chest X-Ray.com. The art and science of thoracic imaging. Omaha, NE. [cited 2014 July 15]. Available from: http://www.chestx-ray.com/index.php/calculators/adrenalcharacterization. 20. Mitchell DG, Crovello M, Matteucci T, et al. Benign adrenocortical masses: diagnosis with chemical shift MR imaging. Radiology. 1992;185:345–51. 21. Mayo-Smith WW, Lee MJ, McNicholas MM, et al. Characterization of adrenal masses (< 5 cm) by use of chemical shift MR imaging: observer performance versus quantitative measures. AJR Am J Roentgenol. 1995;165:91–5. 22. Sebro R, Aslam R, Muglia VF, et al. When is MRI unlikely to characterize an indeterminate adrenal nodule, based on density on an unenhanced CT? Abdominal Radiology Course; Feb 24–Mar 1, 2013; Maui, HI: Society of Abdominal Radiology; 2013. 23. Blake MA, Cronin CG, Boland GW. Adrenal imaging. AJR Am J Roentgenol. 2010;194:1450–60. 24. Haider MA, Ghai S, Jhaveri K, et al. Chemical shift MR imaging of hyperattenuating (> 10 HU) adrenal masses: does it still have a role? Radiology. 2004;231:711–6. 25. Korobkin M, Lombardi TJ, Aisen AM, et al. Characterization of adrenal masses with chemical shift and gadolinium-enhanced MR imaging. Radiology. 1995;197:411–8. 26. Inan N, Arslan A, Akansel G, et al. Dynamic contrast enhanced MRI in the differential diagnosis of adrenal adenomas and malignant adrenal masses. Eur J Radiol. 2008;65:154–62. 27. Krestin GP, Freidmann G, Fishbach R, et al. Evaluation of adrenal masses in oncologic patients: dynamic contrast-enhanced MR vs CT. J Comput Assist Tomogr. 1991;15:104–10. 28. Otal P, Escourrou G, Mazerolles C, et al. Imaging features of uncommon adrenal masses with histopathologic correlation. Radiographics. 1999;19:569–81. 29. Blake MA, Kalra MK, Maher MM, et al. Pheochromocytoma: an imaging chameleon. Radiographics. 2004;24 Suppl 1:S87–99. 30. Rozenblit A, Morehouse HT, Amis ES Jr. Cystic adrenal lesions: CT features. Radiology. 1996;201:541–8. 31. Silva RdC, Castro Md, Kater CE, et al. Insuficiência adrenal primária no adulto: 150 anos depois de Addison. Arq Bras Endocrinol Metab. 2004;48:724–38. 32. Guo YK, Yang ZG, Li Y, et al. Addison's disease due to adrenal tuberculosis: contrast-enhanced CT features and clinical duration correlation. Eur J Radiol. 2007;62:126–31. 33. Yamashita S, Machado JM, Morceli J. Emprego da tomografia computadorizada na detecção de alterações das adrenais em doentes com tuberculose. Radiol Bras. 2004;37:167–70. 34. Agudelo CA, Munoz C, Ramirez A, et al. Identification of Paracoccidioides brasiliensis in adrenal glands biopsies of two patients with paracoccidioidomycosis and adrenal insufficiency. Rev Inst Med Trop S Paulo. 2009;51:45–8. 35. Jordan E, Poder L, Courtier J, et al. Imaging of nontraumatic adrenal hemorrhage. AJR Am J Roentgenol. 2012;199:W91–8. 36. Rana AI, Kenney PJ, Lockhart ME, et al. Adrenal gland hematomas in trauma patients. Radiology. 2004;230:669–75. 37. Sinelnikov AO, Abujudeh HH, Chan D, et al. CT manifestations of adrenal trauma: experience with 73 cases. Emerg Radiol. 2007;13:313–8. 38. Renard J, Clerici T, Licker M, et al. Pheochromocytoma and abdominal paraganglioma. J Visc Surg. 2011;148:e409–16. 39. Korobkin M, Giordano TJ, Brodeur FJ, et al. Adrenal adenomas: relationship between histologic lipid and CT and MR findings. Radiology. 1996;200:743–7. 40. Rha SE, Byun JY, Jung SE, et al. Neurogenic tumors in the abdomen: tumor types and imaging characteristics. Radiographics. 2003;23:29–43. 41. Allolio B, Fassnacht M. Clinical review: adrenocortical carcinoma: clinical update. J Clin Endocrinol Metab. 2006;91:2027–37. 42. Bharwani N, Rockall AG, Sahdev A, et al. Adrenocortical carcinoma: the range of appearances on CT and MRI. AJR Am J Roentgenol. 2011;196:W706–14. 43. Ribeiro RC, Sandrini F, Figueiredo B, et al. An inherited p53 mutation that contributes in a tissue-specific manner to pediatric adrenal cortical carcinoma. Proc Natl Acad Sci U S A. 2001;98:9330–5. 44. Schlund JF, Kenney PJ, Brown ED, et al. Adrenocortical carcinoma: MR imaging appearance with current techniques. J Magn Reson Imaging. 1995;5:171–4. 45. Rashidi A, Fisher SI. Primary adrenal lymphoma: a systematic review. Ann Hematol. 2013:[Epub ahead of print]. 46. Zhang LJ, Yang GF, Shen W, et al. Imaging of primary adrenal lymphoma: case report and literature review. Acta Radiol. 2006;47:993–7. 47. Zhou L, Peng W, Wang C, et al. Primary adrenal lymphoma: radiological; pathological, clinical correlation. Eur J Radiol. 2012;81:401–5. 48. Nacif MS, Jauregui GF, Mello RAF, et al. Linfoma adrenal primário bilateral com envolvimento do sistema nervoso central: relato de caso. Radiol Bras. 2005;38:235–8. 49. Kumar R, Xiu Y, Mavi A, et al. FDG-PET imaging in primary bilateral adrenal lymphoma: a case report and review of the literature. Clin Nucl Med. 2005;30:222–30. 50. Sancho JJ, Triponez F, Montet X, et al. Surgical management of adrenal metastases. Langenbecks Arch Surg. 2012;397:179–94. 51. Karolyi P. Do adrenal metastases from lung cancer develop by lymphogenous or hematogenous route? J Surg Oncol. 1990;43:154–6. 52. Lee JE, Evans DB, Hickey RC, et al. Unknown primary cancer presenting as an adrenal mass: frequency and implications for diagnostic evaluation of adrenal incidentalomas. Surgery. 1998;124:1115–22. 53. Uberoi J, Munver R. Surgical management of metastases to the adrenal gland: open, laparoscopic, and ablative approaches. Curr Urol Reports. 2009;10:67–72. 54. Choi YA, Kim CK, Park BK, et al. Evaluation of adrenal metastases from renal cell carcinoma and hepatocellular carcinoma: use of delayed contrast-enhanced CT. Radiology. 2013;266:514–20. 55. Bagheri B, Maurer AH, Cone L, et al. Characterization of the normal adrenal gland with 18F-FDG PET/CT. J Nucl Med. 2004;45:1340–3. 56. Metser U, Miller E, Lerman H, et al. 18F-FDG PET/CT in the evaluation of adrenal masses. J Nucl Med. 2006;47:32–7. 57. Blake MA, Slattery JM, Kalra MK, et al. Adrenal lesions: characterization with fused PET/CT image in patients with proved or suspected malignancy – initial experience. Radiology. 2006;238:970–7. 58. Benitah N, Yeh BM, Qayyum A, et al. Minor morphologic abnormalities of adrenal glands at CT: prognostic importance in patients with lung cancer. Radiology. 2005;235:517–22. 59. Meehan CP, Fuqua JL 3rd, Reiner AS, et al. Prognostic significance of adrenal gland morphology at CT in patients with three common malignancies. Br J Radiol. 2012;85:807–12. 60. Dietrich CF, Ignee A, Barreiros AP, et al. Contrast-enhanced ultrasound for imaging of adrenal masses. Ultraschall Med. 2010;31:163–8. 61. Friedrich-Rust M, Schneider G, Bohle RM, et al. Contrast-enhanced sonography of adrenal masses: differentiation of adenomas and nonadenomatous lesions. AJR Am J Roentgenol. 2008;191:1852–60. 62. Gupta RT, Ho LM, Marin D, et al. Dual-energy CT for characterization of adrenal nodules: initial experience. AJR Am J Roentgenol. 2010;194:1479–83. 63. Coursey CA, Nelson RC, Boll DT, et al. Dual-energy multidetector CT: how does it work, what can it tell us, and when can we use it in abdominopelvic imaging? Radiographics. 2010;30:1037–55. 64. Gnannt R, Fischer M, Goetti R, et al. Dual-energy CT for characterization of the incidental adrenal mass: preliminary observations. AJR Am J Roentgenol. 2012;198:138–44. 65. Westphalen AC, Coakley FV, Roach M 3rd, et al. Locally recurrent prostate cancer after external beam radiation therapy: diagnostic performance of 1.5-T endorectal MR imaging and MR spectroscopic imaging for detection. Radiology. 2010;256:485–92. 66. Ozturk-Isik E, Crane JC, Cha S, et al. Unaliasing lipid contamination for MR spectroscopic imaging of gliomas at 3T using sensitivity encoding (SENSE). Magn Reson Med. 2006;55:1164–9. 67. Faria JF, Goldman SM, Szejnfeld J, et al. Adrenal masses: characterization with in vivo proton MR spectroscopy – initial experience. Radiology. 2007;245:788–97. 68. Faria JF. Espectroscopia de prótons por ressonância magnética in vivo na caracterização de massas da adrenal. Radiol Bras. 2009;42:198-98. 1. MD, Assistant Professor, Department of Radiology, Keck School of Medicine, University of Southern California, Los Angeles, CA, USA 2. MD, Habiliation, Associate Professor, Department of Internal Medicine – Radiology, Faculdade de Medicina de Ribeirão Preto da Universidade de São Paulo (FMRP-USP), Ribeirão Preto, SP, Brasil 3. MD, Habilitation, Full Professor, Department of Surgery – Urology, Faculdade de Medicina da Universidade Federal do Rio Grande do Sul (UFRGS), Porto Alegre, RS, Brazil 4. MD, PhD, Associate Professor, Departments of Radiology and Biomedical Imaging and Urology, School of Medicine, University of California, San Francisco, CA, USA Mailing Address: Antonio Carlos Westphalen 350 Parnassus Avenue, Suite 307 San Francisco, CA, 94143, USA Email: antonio.westphalen@ucsf.edu Received March 3, 2013. Accepted after revision October 3, 2013. Study developed at University of California, San Francisco Departments of Radiology and Biomedical Imaging and Urology, San Francisco, CA, USA. |
|
Av. Paulista, 37 - 7° andar - Conj. 71 - CEP 01311-902 - São Paulo - SP - Brazil - Phone: (11) 3372-4544 - Fax: (11) 3372-4554
