Radiologia Brasileira - Publicação Científica Oficial do Colégio Brasileiro de Radiologia
AMB - Associação Médica Brasileira CNA - Comissão Nacional de Acreditação
 Vol. 47 nº 2 - Mar. / Apr. of 2014
|
REVIEW ARTICLE
|
|
Functional magnetic resonance imaging in oncology: state of the art |
|
|
Autho(rs): Marcos Duarte Guimaraes1; Alice Schuch2; Bruno Hochhegger3; Jefferson Luiz Gross4; Rubens Chojniak5; Edson Marchiori6 |
|
|
Keywords: Cancer imaging; Magnetic resonance imaging; Oncology; Neoplasia; Functional imaging; Diffusion. |
|
|
Abstract: INTRODUCTION
Ever since Wilhelm Conrad Röntgen discovered x-rays in 1895 in Germany, the field of imaging has been undergoing development and expanding its application in medicine(1). In the field of oncology, imaging has been playing a fundamental role, providing valuable data for a better management of cancer patients. Imaging methods may be utilized in different phases, from screening up to post-therapeutic follow-up(2,3). Radiography, ultrasonography and computed tomography are most frequently utilized and, many times, are the only available methods for the evaluation of cancer patients. Such tools are primarily based upon anatomical abnormalities and, when available, on the pattern of post-contrast enhancement of affected structures(4). However, with advances in the technology and therapy, an exclusively morphological evaluation may be insufficient for appropriate therapeutic decision making. An example of such advances is the application of the "Response Evaluation Criteria In Solid Tumors" (RECIST) whose main focus is the evaluation of the largest diameter of the lesion. Several studies have demonstrated the limitations of such criteria in predicting the biological behavior and therapeutic success. The new oncologic therapies have created a paradigm in the evaluation of cancer patients. The functional criteria became more faithful in depicting the diseases' activity and biological response to treatment, differently from the traditional morphological criteria(5). Currently, magnetic resonance imaging (MRI) is an imaging diagnosis method that is well established in the clinical practice, but it is in continuous development(6). For more than 30 years this method has presented significant progress in different fields of medicine, particularly in cancer patients, including different steps of oncologic management, such as detection, characterization, staging, response evaluation and post-therapeutic follow-up(7). MRI can produce three-dimensional images in a noninvasive way, without the risks of ionizing radiation and with excellent spatial and contrast resolution, allowing for a very accurate tumor evaluation. The innovation is focused principally on improving the anatomical resolution and, more recently, on the advent of functional and molecular methods. Such advances have improved the application of MRI in the evaluation and management of oncologic patients(8). MRI can provide morphological data, such as size, contours, number of lesions, presence of edema and necrosis, relationship with adjacent structures and characteristics related to intravenous contrast enhancement(6). However, physiological and molecular metabolism alterations which normally precede morphological alterations are not usually recognized by traditional morphological techniques. The introduction of novel MRI techniques allowed the evaluation of structures and different physiological processes of the tumor microenvironment(7,8). Combined analysis of anatomical and functional findings allows a more comprehensive evaluation of the extension and activity of neoplastic disease. The appropriate evaluation of the oncologic status allows for the establishment of better therapeutic strategies, with a favorable impact on the prognosis and survival(7-9). Angiogenesis, cell metabolism and cellularity can be evaluated by perfusion, spectroscopy and diffusion, respectively. Theses techniques are examples of functional methods provided by MRI. The present review article is focused on some of the main recent advances of functional MRI and their impact on the management of oncologic patients. DIFFUSION The principle of diffusion-weighted MRI is related to the random motion, also known as "Brownian" motion of water molecules protons throughout the biological tissues. Such motion causes phase dispersion of the spins, resulting in signal loss on diffusion-dispersion sequences. However, in the human body there are natural biological barriers to this motion due to the interaction between cell membranes and macromolecules (Figure 1). Diffusion-weighted imaging (DWI) allows for the qualitative analysis of the water molecules diffusion in the tissues by the interpretation of the signal intensity in the region object of the study. The quantitative analysis can also be performed calculating the apparent diffusion coefficient (ADC) attributing absolute values in mm2/s for the signal intensity of the region object of study(9).  Figure 1. Demonstration of water molecules motion in the intra and extracellular spaces and within the extracellular space providing information on the degree of cellularity of the tissues. On A, there are a greater number of cells restricting the water molecules motion; on B, the cellularity is decreased, with satisfactory molecular motion. The technique is based upon the existence of barriers that restrict the water molecules diffusion in their microenvironment, producing different contrast intensities in different tissues. The motion of such molecules in the intracellular, extracellular and intravascular spaces contributes to the balance of their distribution which reflects the integrity of the barriers found in those structures. Cell membrane is the most known barrier to diffusion of water molecules. Other examples of barriers are: structural components, cell connections, tissue connections such as the cytoskeleton, macromolecules, organelles and tight junctions. Thus different tissues will present specific signal intensity and ADC according to their structural characteristics(9,10). The utilization of this technique has been described by different studies in the literature, including the capacity to identify minimal ischemic tissue injuries in the brain, many times preceding the morphological changes. DWI may also be utilized in the evaluation of other types of brain lesions, including neoplastic (Figure 2), inflammatory, infectious and neurodegenerative diseases(10). 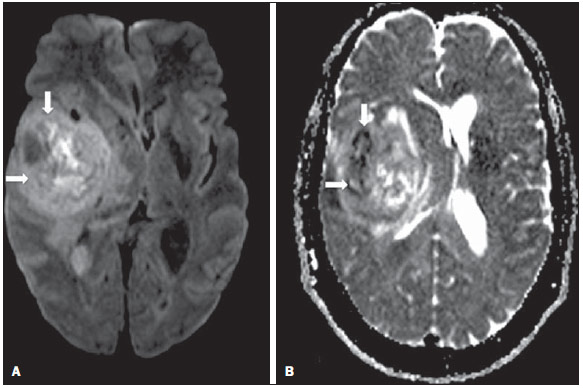 Figure 2. A 37-year-old female patient presenting with glioblastoma multiforme affecting the right parietal lobe. On A, areas of hypersignal are observed at the diffusion sequence (arrows), presenting correlation with areas of signal loss on the ADC map (B), demonstrating restriction to water molecules motion and increased cellularity. Courtesy of Dr. Leonardo Vedolin – Hospital Moinhos de Vento, Porto Alegre, RS, Brazil. The recent advances has also allowed the utilization of DWI in the evaluation of extracranial organs(11,12). The introduction of echo-planar imaging techniques, multichannel coils and parallel MR imaging were decisive for the acquisition of better-quality images, allowing DWI to be utilized in the study of other organs. During the acquisition phase, the reduction of motion artifacts such as those related to heartbeats, breathing and intestinal peristalsis, is aimed to improve the images quality and the analysis of the findings(9). Among the parameters applied in diffusion imaging, one of the most relevant is known as "b value". Such a parameter is capable of adjusting the sensitivity level of this sequence that is proportional to the duration and amplitude of the applied gradient and the time interval between the gradients(10). DWI is typically performed applying two b values at least (for example, b = 0 or a low b, with values between 50 and 100, and a high b, with values between 800 and 1000 s/mm2). On images with low b values, more "anatomical" images are observed, with attenuation of the perfusion effects, i.e., with attenuation of vessels and of the cerebrospinal fluid. However, on images with a high b value, the tissues with increased cellularity are seen with increased signal intensity (Figure 3). In the case of tumor tissues, the water motion is impaired by the presence of several barriers, maintaining the brightness of the signal. However, tissues where cell disorganization is not present usually are visualized with lower signal attenuation (Figure 4). The visual evaluation of signal attenuation at DWI is applied to detect and characterize tumors, as well as to evaluate the treatment response in oncologic patients(9-12).  Figure 3. Diffusion-weighted images with different b values from a 47 year-old female patient presenting with liver hemangioma in the transition between the V and VI segments. The image with b value = 50 s/mm2 is more "anatomical", with attenuation of the perfusion effects, i.e., attenuation of the vessels and spinal fluid (A). On the images with higher b values (B,C) one observes, progressively, attenuation of signal intensity in the healthy tissues, however the hemangioma persists with high signal intensity (tissue with greater cellularity/ T2 effect). Courtesy of Dr. Gustavo Luersen – Hospital Moinhos de Vento, Porto Alegre, RS, Brazil. 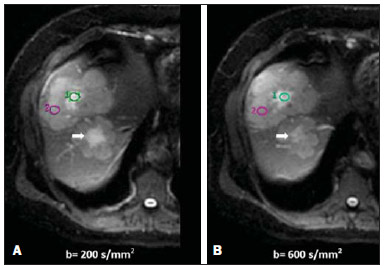 Figure 4. Liver metastases in a 66-year-old female patient presenting with colon adenocarcinoma, undergoing treatment with antiangiogenic drug bevacizumab. Diffusion-weighted images with different b values: 200 s/mm2 (A) and 600 s/mm2 (B). The necrotic center of the metastatic lesions (green ROI and white arrow) shows attenuation of signal intensity, with increasing b values indicating less restriction to diffusion. In comparison, the peripheral zone of the tumor (purple ROI) presents increased cellularity and little signal attenuation with the increase of the b value. Applying different b values it is also possible to perform a quantitative analysis with DWI. This particular analysis is usually performed on a workstation by calculating ADC values (Figure 5). The ADC is independent from the magnetic field intensity and can overcome the "T2 effects", thus allowing for a more significant comparison of the results. The ADC is calculated for each image pixel and is shown as a statistical parametric map. Areas with restriction to water molecules diffusion demonstrate increase signal intensity at DWI and low values at the ADC mapping: demonstrating the correspondence of both (Figure 6). 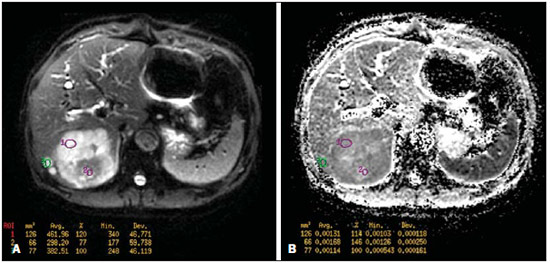 Figure 5. Quantitative analysis of DWI. A 70-year-old male patient presenting with heterogeneous lesion in the hepatic segments VI/VII, with small satellite lesions. On A, diffusion-weighted image (b = 600 s/mm2) demonstrating high signal intensity in the peripheral zone of the dominant lesion (ROI 1 – purple), low central signal (ROI 2 – purple) and high signal intensity in the satellite lesions (ROI 3 – green). On B, ADC map demonstrates correspondence with DWI, with low values in ROI 1 (1.3 × 10⁻³) and in ROI 3 (1.1 × 10⁻³) and higher value in ROI 2 (1.7 × 10⁻³). The anatomopathological analysis confirmed the tumor heterogeneity, a moderately differentiated cholangiocarcinoma with areas of necrosis. 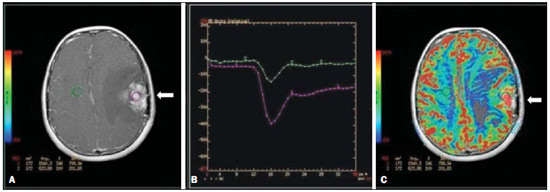 Figure 6. Dynamic MRI (DSC-MRI) of a high-grade neuroglial tumor (arrow) in a 16-year-old patient. On A, axial post-gadolinium T1-weighted image showing two ROIs: 1 (purple) located in the tumor lesion, and 2 (green) located in the healthy tissue. On B, the respective time-signal intensity curve demonstrates greater perfusion in the tumor region in relation to the healthy tissue (> 2.0). On C, the rBV map superimposed on the contrast-enhanced axial T1-weighted image demonstrates increased perfusion in the tumor ROI (arrow). PERFUSION A great part of the molecular imaging techniques utilize exogenous markers that produce the signal from the particle itself or from the pattern of contrast enhancement. For example,, the marker may be a conventional intravenous contrast medium such as gadolinium. The utilization of such agents has occurred with the advent of the dynamic contrast enhanced (DCE) technique or perfusion MRI. In such techniques, the images are sequentially acquired during the contrast agent passage through the tissue of interest, allowing the characterization of lesions in different anatomical sites, including brain, breast, gynecologic and prostate lesions. Such methods are not intrinsically molecular, but allow for an indirect evaluation of molecular processes that affect the blood flow(13). The quantitative and qualitative dynamic analyses of the MRI contrast enhancement may also be useful in the differentiation of benign from malignant musculoskeletal system tumors(14). Nowadays a very promising perfusion MRI technique without the utilization of paramagnetic contrast is available. Such a technique, called arterial spin labeling, has been utilized in the evaluation of the cerebral blood flow, but currently it is available only in more advanced centers(15). The conventional dynamic MRI technique is based on the concept of development of new vessels (angiogenesis) associated with increased blood flow and vessels permeability, which constitute essential conditions for metastatic dissemination of malignant tumors(14,16,17). The microvascular structure of the tumor constitutes a relevant prognostic factor, and perfusion MRI can provide information about this special characteristic in a noninvasive way(13). The images are often acquired after infusion of low molecular weight gadolinium. The distribution of the contrast medium in the intra- and extravascular regions will depend upon some factors such as blood flow, vascular permeability and interstitial diffusion capacity. This technique can be performed with T1-weighted gradient-echo (GRE-T1) and T2-weighted* sequences(13,14). The GRE-T1 sequences can more appropriately characterize the alterations in vessels permeability and extravasation to the extravascular space and are indicated for the evaluation of extracranial regions. The T2-weighted* sequences are more frequently indicated for evaluation of the brain and determine the blood flow volume and capillary tissue perfusion (Figure 6). With those sequences it is possible to perform qualitative, semi-quantitative and quantitative measurements(13,14). Qualitative measurements can be obtained by means of signal intensity-time curves, often utilized in the evaluation of breast carcinomas (Figure 7). Semi-quantitative measurements are related to the differences in signal intensity before and after contrast medium infusion (relative signal intensity). Quantitative measurements are based on pharmacokinetic models which allow for data collection. Thus, it is possible to create color parametric maps demonstrating the tumor behavior which is important, for example, for the therapeutic planning(13,14,16) (Figure 6). 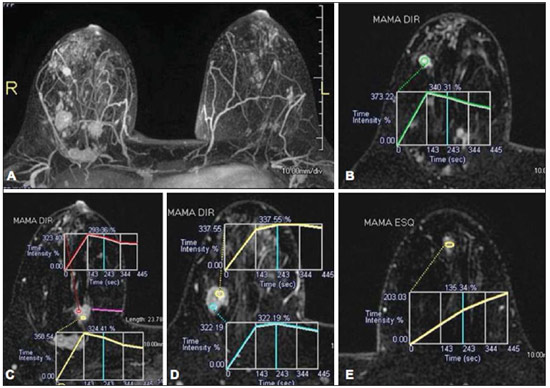 Figure 7. A 30-year-old female patient presenting with multicentric invasive ductal carcinoma in the right breast and fibroadenoma in the left breast. On A, one observes contrast-enhanced, dynamic 3D MIP image with subtraction, demonstrating the presence of multiple breast nodules at right and one retroareolar nodule at left. On B, C and D it is possible to observe that the contrast-enhancement pattern of the breast nodules at right demonstrates characteristics of washout curve and plateau type 3, sometimes observed in malignant nodules. On E, the analysis of the kinetic curve of the breast nodule at left demonstrates characteristics different from the others, showing a type 1 curve, a pattern that is more frequently observed in benign nodules. Courtesy of Dr. Almir Galvão Vieira Bitencourt – A.C.Camargo Cancer Center, São Paulo, SP, Brazil. The data provided by dynamic MRI may be utilized for different purposes. Such evaluation may occur in different phases including diagnosis, staging and treatment response evaluation, particularly in cases where antiangiogenic drugs need to be evaluated (14,16). Data in the literature also attribute a relevant role of perfusion MRI as a prognostic factor and in the evaluation of disease recurrence. Perfusion MRI has been utilized in the evaluation of different types of tumors as a tumor hypoxia biomarker, particularly in cases of well vascularized tumors, such as those in the lungs, uterine cervix, head and neck, breast, liver, musculoskeletal system and colorectal tumors(14,16,17). However, the presence of prominent contrast enhancement at the end of treatment may be associated with a locally aggressive disease, with reduction of survival rates. Angiogenesis studies have continuously evolved over the last years. The advent of macromolecular contrast agents allows for the maintenance of such agents for longer periods in the intravascular spaces. Contrast media containing gadoxetic acid are examples of such agents in the characterization of focal liver lesions. The development of substances directed against molecules expressed by neoangiogenic vessels, as the factor of endothelial vascular growth, is another application field by the perfusion technique(16,17). SPECTROSCOPY Magnetic resonance spectroscopy (MRS) evaluates the distribution and levels of metabolites normally found in healthy tissues as well as increased levels of metabolites usually detected in within tumor(18). Creatine, choline, lactate, citrate, N-acetyl aspartate and adenosine triphosphate are examples of altered metabolites which are commonly found(19). This technique can be indicated, for example, to evaluate breast, prostate and brain lesions(18-20). The main indications of this method are the following: lesion characterization, selection of biopsy site, and evaluation of therapeutic response, among others. This technique can be applied in the evaluation of brain lesions. Increased levels of choline (considered a marker for cell proliferation) in association with decreased levels of creatine (considered a marker for energetic processes) and decreased levels of N-acetyl aspartate (considered a neuronal marker) have been found in the evaluation of brain neoplasms. Combining such levels, it is possible to differentiate, for example, low-grade from high-grade gliomas(18,19) (Figure 8). The application of both conventional MRI and MRS can increases in up to 20% the capability of determining the type and grade of brain tumors. It can differentiate viable tumor from necrotic area important in the evaluation of the tumor response. In the presence of response, a decrease in the choline and N-acetyl aspartate peaks is observed in association with increased levels of lipids and lactate (anaerobic markers)(19). 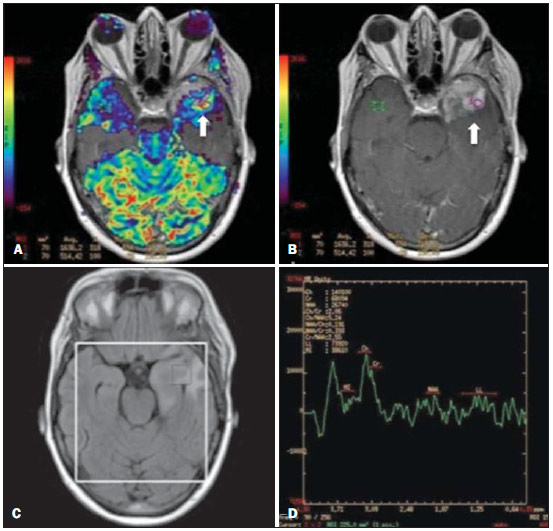 Figure 8. A 55-year-old male patient. Tumor resection (glioblastoma multiforme) in the left temporal lobe six months ago, undergoing treatment with radiotherapy and temodal. MRI scan with advanced techniques was requested for differential diagnosis between recurrence and radionecrosis in post-gadolinium enhancement areas in the surgical site. On A, one observes contrast-enhanced T1-weighted image demonstrating enhancement of the surgical site (arrow). On B, one observes increased perfusion (arrow) on the rBV map (the ROI in this area, compared with a contralateral area of healthy white matter, presenting a ratio >2.6, a value which has been proposed for tumor recurrence. On C and D, the spectroscopy study demonstrates decreased peak of the metabolite Nacetyl aspartate (NAA) and increased choline peak (Cho), corroborating the diagnosis. Courtesy of Dr. Leonardo Vedolin – Hospital Moinhos de Vento, Porto Alegre, RS, Brazil. In the evaluation of breast lesions, for example, association with choline peak may be detected in malignant lesions. However, in benign lesions or in healthy breast tissues, choline levels are either low or undetectable. There are some with this technique that must be highlighted: in the evaluation of lesions < 2 cm, in breastfeeding women (considering the presence of a choline peak in the normal breast tissue) or in the evaluation of some benign lesions such as tubular adenomas, such technique may present discordant results which must be evaluated together with other exams(20). In the evaluation of the prostate spectroscopy obtains metabolic data based on the relative concentration of endogenous metabolites such as choline, creatine, citrate and, most recently, polyamine(21). The absolute values of citrate, creatine and choline levels contribute in the identification of areas suspicious for malignancy and the choline-creatine/citrate ratio demonstrates equivalence with the Gleason score, allowing for a noninvasive selection of areas for prostate biopsy and evaluation of the tumor grade(21,22). Thus, spectroscopy may be employed in the diagnosis of tumor recurrence, in patients treated by radiotherapy, cryotherapy or surgery(21-23). The routine utilization of spectroscopy in the evaluation of other neoplasms is still questionable (Figure 9). 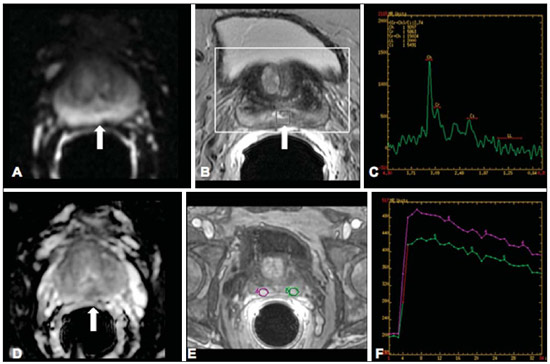 Figure 9. On A, DWI (b = 1000 s/mm2) with high signal intensity in the medial region from 5 o'clock to 7 o'clock (arrow) in the peripheral zone. On B, T2-weighted image demonstrates a subtle ill defined area (arrow). At spectroscopy (C), increased choline peak is observed, with decreased citrate peak (ratio choline + creatine/citrate = 2.7) in the area demonstrated by the ROI of the image on B. On D, the ADC map demonstrates the same area with low signal intensity (arrow) at 6 o'clock in the peripheral zone. On E, the dynamic contrast-enhanced image demonstrates enhancement in the medial region (from 5 o'clock to 7 o'clock). On F, the kinetic curve presents intense and early enhancement (washin) tending towards rapid clearance (washout). Such parameters represent an area suspected for malignancy. WHOLE-BODY MRI Whole-body imaging modalities have been utilized for some time in the evaluation of cancer patients(24). In the last 10 years, positron emission tomography/computed tomography (PET/CT) has been recognized as a tool that improved the performance of the clinical evaluation of cancer patients, providing a more accurate evaluation and allowing for the selection of the most appropriate therapeutic option(25). However, the development of new MRI sequences has been improving the utilization of the method in the evaluation of cancer patients(26). The introduction of echo-planar techniques has allowed the acquisition of whole-body images by means of different sequences such as T1-weighted, T2-weighted, STIR and diffusion. The better management of the effects from artifacts generated by physiological cardiac and respiratory motion has allowed for the acquisition of good functional images which supplement morphological data usually obtained by conventional MRI techniques (Figure 10)(26). 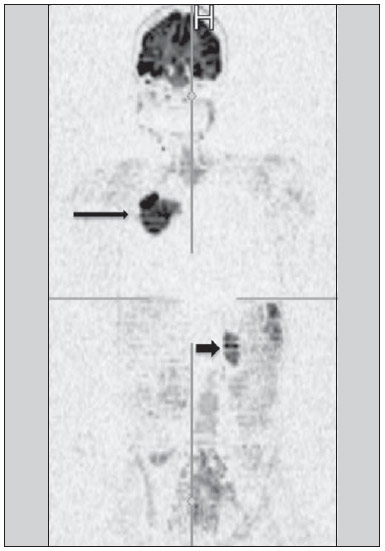 Figure 10. WBMRI is useful in the detection of metastases, particularly in brain, liver and bone lesions. On this figure, a 65-year-old female patient presenting with lung adenocarcinoma in the upper right lobe (long arrow) with metastasis to the left adrenal gland (short arrow). Coronal WBMRI demonstrates the lesions at the diffusion-weighted sequence. Whole-body MRI (WBMRI) is a noninvasive technique free from the risks of ionizing radiation and with high resolution for soft tissues, which can rapidly acquire whole-body images. During the scanning, the body is divided into different portions, and the images are acquired in axial and coronal sections(26). Diffusion-weighted whole-body imaging may be applied to obtain images with body signal suppression. Thus, many organs have their signals removed and the tumor areas with diffusion are identified as intensely bright or with high signal intensity(27,28). Studies in the literature have demonstrated that WBRMI is superior to scintigraphy in the detection of bone metastases as it allows for the visualization of bone marrow infiltration, while bone scintigraphy can only detect the osteoblastic activity(28-30). It is a quite sensitive method for assessing bone lesions in cases of multiple myeloma, as it allows for the direct evaluation of bone marrow involvement by the tumor. Usually, it is more sensitive than computed tomography in the evaluation of disease activity. Additionally, it can be employed in the monitoring of the treatment effectiveness and in the prediction of the treatment response and prognosis(31). For staging purposes, PET/CT has demonstrated accuracy in the evaluation of several types of tumors, particularly in the case of bronchogenic carcinomas, lymphomas and colorectal tumors(32). Moreover, WBMRI is also very useful in the detection of distant metastases, especially to the brain, liver and musculoskeletal system (Figure 11)(33). Such tool may be also applied to evaluate patients with metastases without a known primary tumor. Because of the absence of ionizing radiation risks, is a good option for early detection tumors in asymptomatic individuals, when the disease is still curable(34). 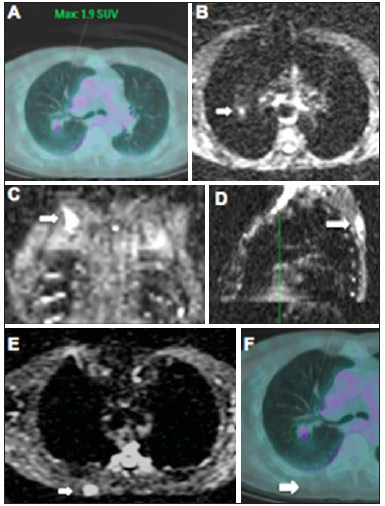 Figure 11. A 69-year-old male patient presenting with a solid and spiculated mass in the right upper lobe, incidentally detected at radiography and with histological diagnosis of adenocarcinoma. At PET/CT (A), there was only normal FDG uptake by the lesion, with no sign of intrathoracic or distant metastases. WBMRI (B) demonstrated irregular hypersignal in the lung lesion and in the dorsal musculature identified on C, D and E, the latter not demonstrated at PET/CT (F). Biopsy confirmed the diagnosis of pulmonary adenocarcinoma metastasis. However, the method presents some limitations such as contraindication for exposure to magnetic fields. The limitations in the evaluation of the lung parenchyma and the long acquisition time are being overcome with the development of more advanced apparatuses and new techniques. Nowadays, a WBMRI scan can be completed in 30 minutes, with satisfactory resolution of the chest structures and with the capability of screening peripheral lesions. Some studies report results equivalent to those obtained by PET/CT(32-34). Additionally, WBMRI may become a useful tool for patients who do not want to be exposed to ionizing radiation or for those patients on whom the effects of radiation might cause severe injuries, such as pregnant patients, children or patients who have been repeatedly exposed during treatment(35). Imaging sequences and WBMRI techniques Currently there is no consensus about which sequences combination provides greater WBMRI accuracy, while maintaining reasonable time efficiency(36). Notwithstanding the following types of sequences are normally utilized: 1 - Short tau inversion recovery (STIR): This is the most utilized sequence in WBMRI. A fast STIR sequence with a typical echo train length between 16 and 30 may be utilized either alone or in combination with other types of sequences(37). The advantages of STIR imaging include the fact that most pathological tissues are rich in protons and have prolonged T1 times and prolonged T2 relaxation times, with consequential high signal intensity on STIR sequences(38). Fat suppression with STIR images is stronger and more homogeneous than fat saturation on T2-weighets images. Coronal STIR sequences may be the only sequences utilized in a WBMRI scan, but limitations are observed in the depiction of the sternum, ribs, scapula and skull(38). Coronal MRI is generally less sensitive than axial MRI in the detection of lymph node disease(39). 2 - T1-weighted fast spin echo (FSE) sequences may be applied in the coronal plane, together with the STIR sequence in order to achieve higher specificity in the detection of spinal cord abnormalities. Coronal T1-weighted fast spin echo sequences are particularly useful in the evaluation of alterations secondary to radiation therapy and metastatic lesions in the fatty marrow(40). 3 - Pre- and post-contrast T1-weighted sequences. According to some authors, such a sequence should be the base of all WBMRI protocols(41). Contrast-enhanced sequences allow for the study of a region in a single breathhold. The liver, for example, can be evaluated in the arterial and venous phases. At the end, the rest of the body can be evaluated for screening metastatic lesions(42). The utilization of gadolinium-based contrast agents improves the sensitivity, specificity and diagnostic accuracy of the method. Its utilization facilitates the combination of local staging and evaluation of metastatic disease in a single scan. 4 - Single-shot sequence: The application of such sequence in both planes, axial and coronal, may be useful in the presence or suspicion of gastrointestinal disease. It has a short acquisition time and may be easily incorporated in the WBMRI protocol, without compromising time efficiency of the method. 5 - Steady-state free precession sequence: A fast sequence of images like this was utilized in a small group of only five patients to detect liver and lung metastases with diameters > 8 mm(43). This type of sequence provides good morphological data and outlines vessels with good accuracy. The chest and abdominal imaging provided by the WBMRI is particularly challenging due to respiratory motion and intestinal peristaltic motion. These may be obtained applying respiratory compensation techniques with extended acquisition time. Antiperistaltic drugs could help to reduce the intestinal motility. It is important to note that in cases where the chest or the abdomen are the location of a primary tumor or area of neoplastic disease, the WBMRI scan is generally performed according to a dedicated imaging protocol including the utilization of respiratory compensation techniques and, sometimes, the administration of anti-peristaltic drugs. PET/MRI Over the past two decades, the continuous utilization of PET/CT in oncology as well as the introduction of WBMRI techniques have led to the fusion of images obtained by both methods (Figure 12) and the development of hybrid PET/MRI equipment(44,45). A limitation that impaired the association of both modalities in a single facility was the fact that the photomultipliers utilized in PET did not operate appropriately within or near the magnetic field. Another limitation was the presence of metalic material in the surface coils, causing interference with the gamma rays and attenuation at PET/CT(46). However, with technological developments obtained in the recent years, some of those barriers were overcome and the first facilities now are available for clinical application (47). 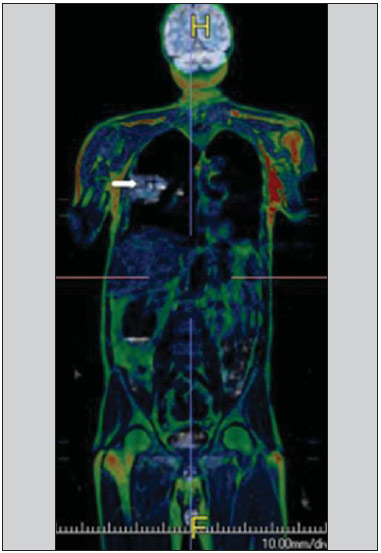 Figure12. A 71-year-old male patient presenting with squamous cell carcinoma in the right upper lobe, with no sign of metastatic lesions at PET/MRI. In this case, there was a fusion of the coronal MRI T1-weighted image with the functional image acquired with FDG-PET/CT. The clinical applications of PET/MRI are under continuous investigation and advances in this field have been documented. Recently published data suggest that PET/MRI adds greater value in the assessment of cancer patients. Some specific advantages are attributed to PET/CT in the detection of bone and lymph node metastases, and to MRI in the detection of brain and liver metastases(47). Furthermore, the advantage of comprehensively scanning the whole body in a single moment would justify the combined utilization of both tools. However, a consensus on the indications and actual benefits in clinical practice is still to be established. CONCLUSION We currently live in the era of individualized treatment. Genetic and intrinsic factors of the tumor are decisive in the evolution of the disease and in the therapeutic approach. The evaluation of functional parameters by MRI is increasing in the clinical set of cancer patients allowing a better understanding of the disease complexity and therapeutic management, with a positive impact on such group of patients. REFERENCES 1. Serkova NJ, Garg K, Bradshaw-Pierce EL. Oncologic imaging endpoints for the assessment of therapy response. Recent Pat Anticancer Drug Discov. 2009;4:36–53. 2. Bragg DG. State-of-the-art assessment. Diagnostic oncologic imaging. Cancer. 1989;64(1 Suppl):261–5. 3. Chojniak R. Imagem em oncologia no CBR. Radiol Bras. 2011;44(3):v. 4. Atri M. New technologies and directed agents for applications of cancer imaging. J Clin Oncol. 2006;24:3299–308. 5. Clarke LP, Croft BS, Nordstrom R, et al. Quantitative imaging for evaluation of response to cancer therapy. Transl Oncol. 2009;2:195–7. 6. González Hernando C, Esteban L, Cañas T, et al. The role of magnetic resonance imaging in oncology. Clin Transl Oncol. 2010;12:606–13. 7. Higgins LJ, Pomper MG. The evolution of imaging in cancer: current state and future challenges. Semin Oncol. 2011;38:3–15. 8. Histed SN, Lindenberg ML, Mena E, et al. Review of functional/anatomical imaging in oncology. Nucl Med Commun. 2012;33:349–61. 9. Padhani AR. Diffusion magnetic resonance imaging in cancer patient management. Semin Radiat Oncol. 2011;21:119–40. 10. Koh DM, Takahara T, Imai Y, et al. Practical aspects of assessing tumors using clinical diffusion-weighted imaging in the body. Magn Reson Med Sci. 2007;6:211–24. 11. Padhani AR, Koh DM. Diffusion MR imaging for monitoring of treatment response. Magn Reson Imaging Clin N Am. 2011;19:181–209. 12. Testa ML, Chojniak R, Sene LS, et al. Ressonância magnética com difusão: biomarcador de resposta terapêutica em oncologia. Radiol Bras. 2013;46:178–80. 13. Zweifel M, Padhani AR. Perfusion MRI in the early clinical development of antivascular drugs: decorations or decision making tools? Eur J Nucl Med Mol Imaging. 2010;37 Suppl 1:S164–82. 14. Costa FM, Vianna EM, Domingues RC, et al. Espectroscopia de prótons e perfusão por ressonância magnética na avaliação dos tumores do sistema musculoesquelético. Radiol Bras. 2009;42:215–23. 15. Gonçalves FG, Maldjian JA. Novidades em radiologia – Arterial spin labeling, a perfusão por RM sem contraste. Radiol Bras. 2011;44(1):ix–xi. 16. Harry VN, Semple SI, Parkin DE, et al. Use of new imaging techniques to predict tumour response to therapy. Lancet Oncol. 2010;11:92–102. 17. Kwee TC, Takahara T, Klomp DW, et al. Cancer imaging: novel concepts in clinical magnetic resonance imaging. J Intern Med. 2010;268:120–32. 18. Porto L, Kieslich M, Franz K, et al. MR spectroscopy differentiation between high and low grade astrocytomas: a comparison between paediatric and adult tumours. Eur J Paediatr Neurol. 2011;15:214–21. 19. Kauppinen RA, Peet AC. Using magnetic resonance imaging and spectroscopy in cancer diagnostics and monitoring: preclinical and clinical approaches. Cancer Biol Ther. 2011;12:665–79. 20. Baltzer PA, Dietzel M. Breast lesions: diagnosis by using proton MR spectroscopy at 1.5 and 3.0 T – systematic review and meta-analysis. Radiology. 2013;267:735–46. 21. Baroni RH, Novis MI, Caiado AHM, et al. Ressonância magnética da próstata: uma visão geral para o radiologista. Radiol Bras. 2009;42:185–92. 22. Boonsirikamchai P, Choi S, Frank SJ, et al. MR imaging of prostate cancer in radiation oncology: what radiologists need to know. Radiographics. 2013;33:741–61. 23. Goldman SM. Ressonância magnética da próstata. Radiol Bras. 2009;42(3):vii–viii. 24. Martí-Bonmatí L, Sopena R, Bartumeus P, et al. Multimodality imaging techniques. Contrast Media Mol Imaging. 2010;5:180–9. 25. Griffeth LK. Use of PET/CT scanning in cancer patients: technical and practical considerations. Proc (Bayl Univ Med Cent). 2005;18:321–30. 26. Carty F, Shortt CP, Shelly MJ, et al. Whole-body imaging modalities in oncology. Semin Musculoskelet Radiol. 2010;14:68–85. 27. Koh DM, Blackledge M, Padhani AR, et al. Whole-body diffusionweighted MRI: tips, tricks, and pitfalls. AJR Am J Roentgenol. 2012;199:252–62. 28. Koh DM, Collins DJ. Diffusion-weighted MRI in the body: applications and challenges in oncology. AJR Am J Roentgenol. 2007;188:1622–35. 29. Tan CH, Wei W, Johnson V, et al. Diffusion-weighted MRI in the detection of prostate cancer: meta-analysis. AJR Am J Roentgenol. 2012;199:822–9. 30. Takenaka D, Ohno Y, Matsumoto K, et al. Detection of bone metastases in non-small cell lung cancer patients: comparison of wholebody diffusion-weighted imaging (DWI), whole-body MR imaging without and with DWI, whole-body FDG-PET/CT, and bone scintigraphy. J Magn Reson Imaging. 2009;30:298–308. 31. Padhani AR, Khan AA. Diffusion-weighted (DW) and dynamic contrast-enhanced (DCE) magnetic resonance imaging (MRI) for monitoring anticancer therapy. Target Oncol 2010;5:39–52. 32. Komori T, Narabayashi I, Matsumura K, et al. 2-[fluorine-18]-fluoro-2-deoxy-D-glucose positron emission tomography/computed tomography versus whole-body diffusion-weighted MRI for detection of malignant lesions: initial experience. Ann Nucl Med. 2007;21:209–15. 33. Heusner TA, Kuemmel S, Koeninger A, et al. Diagnostic value of diffusion-weighted magnetic resonance imaging (DWI) compared to FDG PET/CT for whole-body breast cancer staging. Eur J Nucl Med Mol Imaging. 2010;37:1077–86. 34. Guimaraes MD, Chojniak R. Molecular imaging enhances diagnostic and management targets in patients with cancer of unknown primary site. AJR Am J Roentgenol. 2013;201:W919. 35. Davies HE, Wathen CG, Gleeson FV. The risks of radiation exposure related to diagnostic imaging and how to minimise them. BMJ. 2011;25;342:d947. 36. Mazumdar A, Siegel MJ, Narra V, et al. Whole-body fast inversion recovery MR imaging of small cell neoplasms in pediatric patients: a pilot study. AJR Am J Roentgenol. 2002;179:1261–6. 37. Kellenberger CJ, Epelman M, Miller SF, et al. Fast STIR wholebody MR imaging in children. Radiographics. 2004;24:1317–30. 38. Darge K, Jaramillo D, Siegel MJ. Whole-body MRI in children: current status and future applications. Eur J Radiol. 2008;68:289– 98. 39. Hirsch W, Krohmer S, Kluge R, et al. Preliminary results in wholebody MRI in children – a prospective study [abstract]. Pediatr Radiol. 2005;35(Suppl):S89. 40. Krohmer S, Sorge I, Krausse A, et al. Whole-body MRI for primary evaluation of malignant disease in children. Eur J Radiol. 2010;74:256–61. 41. Lauenstein TC, Semelka RC. Emerging techniques: whole-body screening and staging with MRI. J Magn Reson Imaging. 2006;24:489–98. 42. Lauenstein TC, Goehde SC, Herborn CU, et al. Whole-body MR imaging: evaluation of patients for metastases. Radiology. 2004;233:139–48. 43. Barkhausen J, Quick HH, Lauenstein T, et al. Whole-body MR imaging in 30 seconds with real-time true FISP and a continuously rolling table platform: feasibility study. Radiology. 2001;220:252–6. 44. Schwenzer NF, Pfannenberg C, Reischl G, et al. Application of MR/PET in oncologic imaging. Rofo. 2012;184:780–7. 45. Werner MK, Schmidt H, Schwenzer NF. MR/PET: a new challenge in hybrid imaging. AJR Am J Roentgenol. 2012;199:272–7. 46. Vaska P, Cao T. The state of instrumentation for combined positron emission tomography and magnetic resonance imaging. Semin Nucl Med. 2013;43:11–8. 47. von Schulthess GK, Kuhn FP, Kaufmann P, et al. Clinical positron emission tomography/magnetic resonance imaging. Semin Nucl Med. 2013;43:3–10. 1. MSc and PhD Fellow, MD, Radiologist, Specialist in Chest and Oncological Imaging, Hospital Heliópolis and A.C.Camargo Cancer Center, São Paulo, SP, Brazil 2. MD, Radiologist, Full Member of Colégio Brasileiro de Radiologia e Diagnóstico por Imagem (CBR), Specialist in Oncological Imaging, MD, Hospital Moinhos de Vento, Porto Alegre, RS, Brazil 3. Post-PhD, MD, Associate Professor, Universidade Federal de Ciências da Saúde de Porto Alegre (UFCSPA), Porto Alegre, RS, Brazil 4. PhD, MD, Oncological Surgeon, Head of Thoracic Surgery Department, A.C.Camargo Cancer Center, São Paulo, SP, Brazil 5. PhD, Head of Imaging Department, A.C.Camargo Cancer Center, São Paulo, SP. Brazil 6. PhD, Full Professor, Universidade Federal Fluminense (UFF), Niterói, RJ, Associate Professor, Universidade Federal do Rio de Janeiro (UFRJ), Rio de Janeiro, RJ, Brazil Mailing Address: Dr. Marcos Duarte Guimarães Rua Paulo Orozimbo, 726, Cambuci São Paulo, SP, Brazil, 01535-001 E-mail: marcosduarte500@gmail.com Received May 27, 2013. Accepted after revision September 17, 2013. Study developed in the Imaging Department at A.C.Camargo Cancer Center, São Paulo, SP, Brazil. |
|
Av. Paulista, 37 - 7° andar - Conj. 71 - CEP 01311-902 - São Paulo - SP - Brazil - Phone: (11) 3372-4544 - Fax: (11) 3372-4554