Radiologia Brasileira - Publicação Científica Oficial do Colégio Brasileiro de Radiologia
AMB - Associação Médica Brasileira CNA - Comissão Nacional de Acreditação
 Vol. 45 nº 1 - Jan. /Feb. of 2012
|
ORIGINAL ARTICLE
|
|
Display quality control based on luminance measurements in post-processing units at imaging diagnosis centers |
|
|
Autho(rs): Márcia Pinto1; Maria Pedro1; António Santos2; António Saraiva3 |
|
|
Keywords: Quality control; Luminance; Illuminance. |
|
|
Abstract: INTRODUCTION
The arrival of the technological age, most precisely the digital radiology, has brought about changes in the components of imaging services, from the examination room to treatment and diagnosis. The utilization of displays for the visualization of medical images was introduced in the 1970's. Primarily, the utilization of displays was associated with computed tomography and later, with ultrasonography, digital radiology and magnetic resonance imaging. The picture archiving and communication systems (PACS) became a reality only when computers and networks became able to perform file exchange and storage in real time. Following such development, the displays devices themselves needed to be adapted for visualization of medical images. The early color cathode ray tubes (CRTs) presented defects related to luminance, contrast resolution and geometric distortion, leading to the development of high-quality monochrome CRTs with special phosphor coatings which produced high luminance levels(1). With such changes the displays were able to match image quality and resolution with those obtained with conventional radiology films. In the mid 1990's, liquid crystal displays (LCDs) were introduced, and also were also adapted for the medical imaging market, with high luminance and resolution(1). Over time, LCDs became preferable to CRTs, as they lasted longer, had higher luminance, lower weight and generated less heat, among other factors. In order to match the convenience of negatoscopes for the visualization of multiple images, workstations equipped with sets of two and four displays have been utilized(1). In spite of the high investment in equipment observed at digital radiology services, quality control is undervalued by such services. The present study was aimed at assessing display devices for diagnosis and visualization/treatment by means of the measurement of parameters such as luminance and illuminance, comparing such measurement results with values recommended by internationally recognized associations. Such parameters, among others, are extremely relevant, since their inadequacy may negatively affect the diagnostic image quality. The Report 03 of the American Association of Physicists in Medicine (AAPM) is a comprehensive document about visualization systems and their quality control. It describes the different types of display devices utilized in the visualization of medical images and also outlines the different standard tests for their evaluation(2). Certain technical requirements, such as being calibrated according to the DICOM grayscale standard display function (GSDF) and present minimum values for certain photometric parameters, must be met by the displays device in order to allow the visualization of radiological images with consistency and quality(3). Radiological images present varied gray levels not always perceptible by the human eye. On account of this fact, there is a DICOM GSDF standard to assure that a professional is able to observe that a pixel value of 200 presents twice the brightness of a pixel value of 100. For that reason, the displays are calibrated so that the difference between each level and the next is of at least 1 JND (just noticeable difference). The luminance of such gray scales is determined by the LUT (look up table), that is found either on the computer or on the display device itself(4). However, while DICOM GSDF contributes to a correct perception of the image, it does not play a significant role in other relevant aspects of the image quality on the display screen, such as the illuminance, luminance and luminance ratio(4). Luminance is the visible amount of light emitted or reflected per second per area unit, per unit of solid angle on a surface(2). In the present case, it is the brightness or light projected by the display screen, measured in candles per square meter (cd/m2) or nit. Illuminance, or ambient lighting, is the luminous flux perpendicularly incident on a surface per area unit (m2) expressed in lumens per square meter (lm/m2) or lux. According to the AAPM Report 03, there are two types of medical displays devices. The primary displays are those utilized in the interpretation of medical images, for example, by physicians specialized in radiology. Secondary displays are those utilized for the visualization of medical images, for example by radiology technicians or other health professionals. The secondary displays in the present study sample are typically connected to workstations that serve the purposes of treatment support and/or image printing. As the performance of treatment displays have a direct impact on the images presented on other displays, such a performance must meet a minimum acceptable level. Ideally, such minimum levels should be equal to the luminance levels of the primary displays(5). Normally, the maximum luminance value (Lmax) recommended by the manufacturer is equivalent to the highest possible value which does not interfere with other performance parameters, such as resolution or display life span. In cases where the manufacturers' recommendation for such parameters is not available, internationally established recommendations should be followed(6). The AAPM and The Royal College of Radiologists (RCR) have developed guidelines establishing Lmax values, luminance ratio, illuminance and dimensions for primary and/or secondary displays. On the AAPM Report 03, the reference values for primary displays are the following: from 2 to 10 lux for illuminance; Lmax > 170 cd/m2 and luminance ratio > 250 cd/m2. As regards secondary displays, the values are the following: 50 to 180 lux for illuminance; Lmax > 100 cd/m2 and luminance ratio > 100 cd/m2. The reference levels recommended by RCR guidelines for the primary displays are the following: 15 lux for illuminance, Lmax > 500 cd/m2, luminance ratio > 500:1 cd/m2 and display dimension > 20 inches. In the literature, it is also indicated that, in the case of workstations with multiple displays, the maximum Lmax difference among them cannot be > 10%(6). MATERIALS AND METHODS The investigation was carried out on 23 primary displays and 22 secondary display devices in five public health institutions in the central Portugal region, following the recommendations described on the AAPM Report 03(5). The present study was focused on the evaluation of primary and secondary displays of conventional radiography systems. The data were collected by means of a Unfors Xi luminance detector, calibrated according to the National Institute of Standards and Technology (NIST), with a calibration error < 2%. Such detector is comprised by an optical tube and a light blocking ring that attaches over the light sensor zone, allowing direct contact of such light blocking ring with the screen surface, thus avoiding the need for dark room conditions during measurements. With such equipment, it is possible to measure luminance values ranging between 0.05 and 50,000 cd/m2, with a resolution of 0.01 cd/m2. The AAPM Report 03 provides various protocols and tests for the evaluation of parameters such as contrast, reflection, noise, resolution and luminance among others. The TG18-LN test pattern (available on-line) was selected to evaluate Lmax and luminance ratio(7). The 12-bit version of TG18-LN test in the DICOM format (Figure 1) is constituted by a set of 18 images with different luminance levels. Each image consists of a central testing region with a determined pixel value, occupying 10% of the total area, with the remaining area on the image comprising a uniform background with a luminance level equal to 20% of the maximum luminance value(5). By following the protocol described on the Report 03, one measurement was performed for each one of the 18 images (Figure2), with the pixel value at the central region of each image ranging from 0 to 4.080(5). 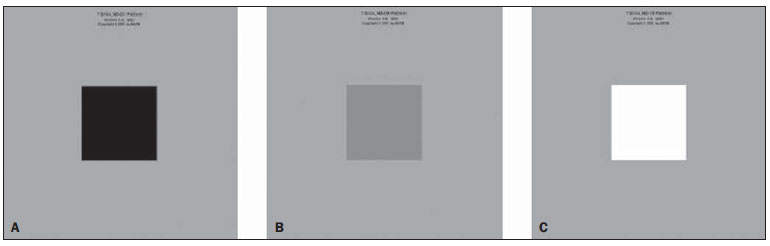 Figure 1. Examples of images according to the TG18-LN pattern. TG18-LN12-01 pattern (A), TG18-LN12-08 pattern (B) and TG18-LN12-18 pattern (C). Source: American Association of Physicists in Medicine(7). 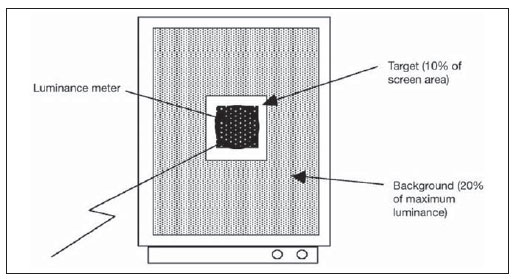 Figure 2. Luminance measurement scheme with the TG18-LN test pattern. Source: American Association of Physicists in Medicine(7). In the case of secondary displays, as they were fitted with manual adjustment of screen brightness, at least two measurements per 18-image set were performed, corresponding to maximum brightness, minimum brightness or found brightness (since in some cases the found brightness was equal to the maximum brightness or to the minimum brightness). In the case of the primary displays, only six of them were equipped with manual brightness control, while the others had internal self-adjusting brightness controls. A Delta Ohm HD 9221 lux meter was utilized for illuminance measurements. Such a measurement device, calibrated according to the NIST, has an automatic scale change feature, allowing the measurement of values between 0 and 200,000 lux, with a resolution of 0.1 for measurements below 200 lux and 1 for measurements above 200 lux. Its stability is 0.15% and standard deviation is 0 ± 0,06%/ºC. A recording framework was created to allow storage of the following data:
The recording of luminance measurements results was made by means of the Unfors Xi View detector, with direct data transfer through USB port. The data collection was performed by means of a consistent and systematic method comprising some pre-defined steps, as follows: assurance of a minimum 30-minute warm-up for testing each display device; cleaning of the display screen surface; checking of the brightness window and recording of the brightness results in those devices where this is possible; assembling and stabilization of the measurement device by means of a tripod in the area defined for testing; measurements performed with the display devices in the standby mode. From the first to the last measurement, the detector could not be moved, with all measurements being performed in the same location with all the changes in the display devices settings being reversed to found adjustments at the beginning of the measurements. On average, each measurement took 20 to 30 minutes to be completed. Most of the measurements were performed out of the services' working hours. The following parameters were considered in the present investigation: L'max + Lamb / L'min + Lamb considering the ambient light, in this case, non significant(5). Applied statistical inference methods A specialized statistical software, the SPSS version 16, was utilized for data processing, the SPSS release 16, resorting to the qui-squared (χ2) adherence test, to the Student's t-test for one sample, and to the Spearman's Rho (ρs) correlation test, to the R Pearson's correlation test, to the qui-squared (χ2) test for independence test and to the Student's t test for independent samples. For relationship analysis, the following reference values were utilized: p value > 0.05, no relationship; p value < 0.05, statistically significant relationship. As regards correlation, the reference values were the following: R < 0.2: very poor and non-statistically significant correlation; R [0.20.39]: poor correlation; R [0.40.69]: moderate correlation; R [0.70.89]: strong correlation; R [0.91]: very high correlation. Such values were the same for negative correlations(8). RESULTS Among the 23 primary displays at the studied hospitals, six were equipped with manual brightness control. The remaining 17 were equipped with a sensor for self-adjusting luminance level, and for that reason, a single measurement was performed for each one of those display devices. On the secondary displays, as the value for Lmax (Table 1) was compared with the values established by the AAPM Report 03 recommendations, the variation was not significant (α > 0.05), with a mean difference of 23.30 cd/m2, as compared with the standard value of 100 cd/m2, with a standard deviation of 58.48 cd/m2. Measurements with values < 100 cd/m2 were obtained in nine displays. 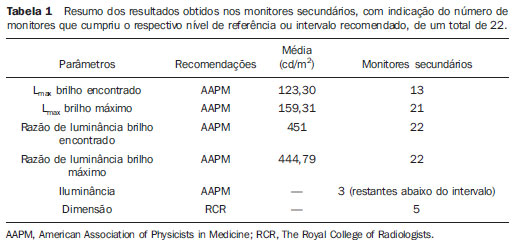 On the secondary displays, the Lmax values with maximum brightness were significantly above (α = 0.001) the reference value of 100 cd/m2, with a standard deviation of 41.94 cd/m2 (Table 1). The mean difference value was 59.31 cd/m2. Only one display did not reach the reference value. The brightness Lmax values observed on the primary displays presented a significant variation, above the minimum value of 170 cd/m2, with the mean difference value corresponding to 208.33 cd/m2 (Table 2). Four of the 22 displays were not compliant with the minimum value. As regards the reference value of 500 cd/m2, the values were significantly lower (α = 0.001), and in this case, with a mean difference of 121.66 cd/m2, with 19 displays not complying with such minimum reference value. The global mean value of brightness Lmax found on the 23 displays was 378.33cd/m2, with a standard deviation of 142.96 cd/m2 (Table 2). 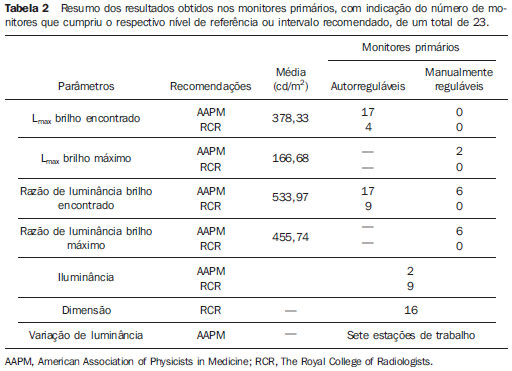 For the primary displays equipped with manual brightness control, and Lmax, with maximum brightness as compared with the minimum reference value of 170 cd/m2, the global mean luminance for the six displays was lower, with non-statistically significant difference (α > 0.05). Four of such displays did not reach the reference value. The mean difference was 3.31 cd/m2 lower than the reference value. In the case of reference value of 500 cd/m2, the found values were significantly lower (α = 0.001), with a mean difference of 333.31 cd/m2. None of the 6 displays complied with the 500 cd/m2 reference value. The global mean value was 166.68 cd/m2 and standard deviation was 24.62 cd/m2 (Table 3). 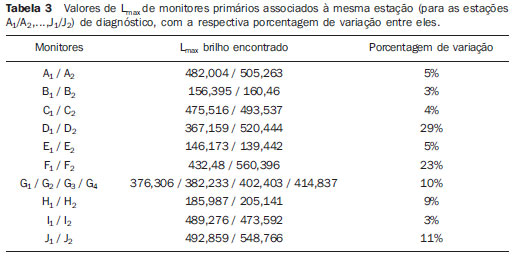 In the analysis of luminance ratio on the primary displays, the values for brightness luminance ratio were significantly higher than the reference value of 250 cd/m2, with a mean difference of 283.97 cd/m2. Only one display did not reach the reference value. For the reference value of 500 cd/m2, the difference in results was not significant (33.97 cd/m2). Even though 14 of the 23 displays presented luminance ratio < 500 cd/m2. The mean global value was 533.97 cd/m2, with standard deviation of 185.57 cd/m2 (Table 3). As regards the brightness luminance ratio observed on the secondary displays, the mean global luminance ratio was significantly above the reference value of 100 cd/m2, with a value of 451 cd/m2. The estimated difference was approximately 351 cd/m2, with standard deviation of 217.24 cd/m2. As the secondary displays were evaluated in relation to their own luminance ratio criterion, presented a mean difference that was higher than that of the primary displays with respect to their reference values. Illuminance levels measured on the primary display workstations were mostly outside the 2 to 10 lux interval (74%), despite the non-statistically significance. Only approximately 9% of the displays were found to be within the recommended interval, and 17% of them were significantly above such interval, between 50 and 180 lux. In cases where a reference value of 15 lux was considered, the difference was not significant, although approximately 60% of the displays were above such value. The illuminance levels measured on the secondary display workstations were found to be within the interval or below the maximum recommended levels. The analysis of the diagonal size of the primary and secondary display screens (in inches) demonstrated that there is an association between display type and size. While 70% of the primary displays presented the recommended dimensions, approximately 30% of them did not, a higher rate as compared with the rate of non compliant secondary displays (23%). No statistically significant correlation was observed between the number of years of life of each display and brightness Lmax and maximum brightness values (α > 0.05). However, it could be observed that in 28 of the 45 displays (with adjustable brightness at the maximum) the best brightness was associated with the best maximum brightness. Among the 28 displays, 41% revealed such a pattern. In this comparison, as primary and secondary displays were separated, the tendency towards no association between displays life span and Lmax was maintained. As the rate of variation in the Lmax on primary displays connected to a single diagnosis workstation, most (57.1%) of the workstations with self-adjusting displays presented a luminance difference < 10%, while all three workstations equipped with manually adjustable displays were within this condition. DISCUSSION In general, the primary displays were within the recommended parameters. Although not significantly, only the values for displays size were low, while the illuminance values were above the minimum values or intervals. It is important to highlight that the brightness Lmax values were not compliant with test requirements with regards to the reference level for luminance ratio of 500 cd/m2 (described on RCR document). Such values were significantly low, particularly in the case of manually adjustable displays, which as separately analyzed, presented greater discrepancy in relation to reference values. Hence, one might consider that the quality of self-adjusting displays would be better. However, the authors of the present study consider the hypothesis that the size of the sample of manually adjustable displays is insufficient, as well as it is not possible to compare different makes and models of display devices in this particular study. It is important to mention that, in spite of the small size of the sample, the manually adjustable display pairs connected to a single diagnosis workstation, presented Lmax variation < 10% between them, differently from some sets of self-adjusting displays. On three workstations, differences > 10% in Lmax were observed between displays. For the standard values tested on secondary displays, such as luminance ratio, Lmax and illuminance, the results were in most cases either significantly superior, or were mostly within the established parameters. However the brightness observed on the display devices was variable, in some of them being as low as 0% or as high as 100%, which is not correct for images visualization and also with respect to the display devices life span. Regarding the analysis of the association between Lmax and displays life spam (both for primary and secondary displays), the results demonstrated absence of such a correlation. Such analysis may have been impaired, considering that the studied display devices were relatively new (< 5 years). As regards the ambient lighting in the workplaces, the effective and comfortable perception by the professional performing the visual task depends on the light intensity distribution(9). Several authors have demonstrated that the illuminance effect on displays causes degradation of the low contrast detail detection threshold(4). The illuminance causes reflection artifacts and loss in the quality of the display screen(6). The effect of Lmax on the perceived image quality and its variation along time represent important factors as the global performance of the display is evaluated. The luminance ratio is associated with the decrease in the JND index, or the number of small luminance increments on the image(10). In order to attain primary (diagnostic) and secondary (clinical) displays image agreement, the radiology technician should frequently check with the radiologist that the images are being transmitted with appropriate quality(11). CONCLUSION Some factors must be taken into consideration in the acquisition and installation of equipment for medical image visualization. Along the present study one observes that, as reported in the literature, the LCD is a good option for softcopy viewing and processing of medical images. Ambient lighting and ergonomic factors must be taken into consideration in the installation of such devices, additionally to the implementation of displays quality control protocols. According to the AAPM Report 03, imaging diagnosis displays should undergo yearly inspections by an engineering expert and also monthly inspections by a quality control technician in order to detect abnormalities and non-compliance with specific parametric values. The quality control periodicity may be lower in those systems which automatically evaluate and stabilize the minimum and maximum luminance. The imaging diagnosis display is the last link in the chain of medical imaging. With the variability of technologies and physical degradation as the equipment ages, such display devices must be carefully evaluated in order to demonstrate an appropriate and stable performance along its life span. Therefore, the displays utilized for softcopy viewing and processing of medical images must be regularly verified in order to properly maintain the required quality levels for the function they perform. In the present study, the displays demonstrated a satisfactory performance, and the authors conclude that the adoption of an appropriate quality control plan will have a significant impact on the service provided by the health professional. The agreement between primary (diagnostic) and secondary (clinical) displays is invaluable, as it allows the radiology technician who adjusts a radiological image to appropriate diagnostic levels to do it effectively in order to assure a consistent image reproduction on both types of displays. The conclusions from the present study should be understood as the result from a case study to be validated by further studies in order to allow their dissemination. REFERENCES 1. Hirschorn DS. Image displays. In: Dreyer KJ, Hirschorn DS, Thrall JH, et al., editors. PACS A guide to the digital revolution. 2nd ed. New York, NY: Springer; 2006. p. 34762. 2. Aldrich JE, Rutledge JD. Assessment of PACS display systems. J Digit Imaging. 2005;18:28795. 3. The Royal College of Radiologists. Picture archiving and communication systems (PACS) and quality assurance. [cited 2008 Apr 7]. Available from: http://www.rcr.ac.uk/docs/radiology/pdf/IT_guidance_QAApr08.pdf 4. Thompson DP, Koller CJ, Eatough JP. Practical assessment of the display performance of radiology workstations. Br J Radiol. 2007;80:25660. 5. American Association of Physicists in Medicine. AAPM On-Line Report No. 03. Assessment of display performance for medical imaging systems. [cited 2009 Mar 2]. Available from: http://deckard.mc.duke.edu/~samei/tg18_files/tg18.pdf 6. Samei E, Badano A, Chakraborty D, et al. Assessment of display performance for medical imaging systems: executive summary of AAPM TG18 report. Med Phys. 2005;32:120525. 7. American Association of Physicists in Medicine (AAPM) Task Group 18. [cited 2009 Sep 14]. Available from: http://www.duke.edu/~samei/tg18.html 8. Pestana MH, Gageiro JN. Análise de dados para ciências sociais. A complementaridade do SPSS. 5ª ed. Lisboa, Portugal: Edições Silabo; 2008. 9. International Organization for Standardization. ISO 8995:2002. Lighting of indoor work places. 2nd ed. Vienna, Austria; 2002. 10. Fifadara DH, Averbukh A, Channin DS, et al. Effect of viewing angle on luminance and contrast for a five-million pixel monochrome display and a nine-million-pixel color liquid crystal display. J Digit Imaging. 2004;17:26470. 11. Carter C, Vealé B. Quality control and quality management. In: Carter C, Vealé B, editors. Digital radiography and PACS. St. Louis, MO: Mosby/Elsevier; 2008. p. 196207. 1. Licenciate, Radiologist Technicians, College of Health Technology of Coimbra, Portugal. 2. PhD, Full Professor at College of Health Technology of Coimbra, Portugal. 3. Master, Full Professor of Radiology at College of Health Technology of Coimbra, Portugal. Mailing Address: Dr. António Saraiva Departamento de Radiologia Escola Superior de Tecnologia da Saúde de Coimbra (ESTeSC) Rua 5 Outubro, Apartado 7006 3046-854 Coimbra, Portugal E-mail: asaraiva@estescoimbra.pt Received July 8, 2011. Accepted after revision January 11, 2012. Study developed at College of Health Technology of Coimbra, Portugal. |
|
Av. Paulista, 37 - 7° andar - Conj. 71 - CEP 01311-902 - São Paulo - SP - Brazil - Phone: (11) 3372-4544 - Fax: (11) 3372-4554