Radiologia Brasileira - Publicação Científica Oficial do Colégio Brasileiro de Radiologia
AMB - Associação Médica Brasileira CNA - Comissão Nacional de Acreditação
 Vol. 40 nº 1 - Jan. /Feb. of 2007
|
ORIGINAL ARTICLE
|
|
Lumbar spine computed tomography after arthrodesis with metal implant: a qualitative evaluation of images reconstructed with different mathematical algorithms |
|
|
Autho(rs): José Augusto Marconato, Flávio Franciosi Aesse, José Hamilton Pinheiro Ferreira, Cláudio Pitta Pinheiro, Alessandro André Mazzola |
|
|
Keywords: Computed tomography, Arthrodesis, Lumbar spine, Image quality |
|
|
Abstract:
IMaster Degree in Science, Physicist at Hospital Moinhos de Vento, Professor at Fundação Saint Pastous
INTRODUCTION Spinal fusion with metal implants has been utilized for someyears, and postoperative evaluation may be performed by means ofimaging diagnosis methods such us conventional x-ray, computedtomography (CT) or magnetic resonance imaging (MRI). These threemethods present advantages and disadvantages, conventional x-raybeing the lowest cost alternative although it does not allow adetailed visualization of the rachidian canal and soft tissues.In some cases, several views may be necessary. MRI is a lessutilized method because of its high cost; additionally, metalimplants may cause artifacts, which many times make the methodunfeasible. On the other hand, multidetector CT is the mostcomplete method, despite the disadvantage of its high cost whencompared with the conventional x-ray(1). As regards the radiation dose, an study of the United NationsScientific Committee on the Effects of Atomic Radiation presentseffective doses for conventional lumbar spine x-ray studies inseveral countries, ranging from low to high levels in relation toCT studies, depending on the parameters utilized as well as onthe number of views(2). Currently, CT equipment can control the radiation doseaccording to the anatomical region and the size of the patient,resulting in a considerable reduction of the effective radiationdose. Additionally, such equipment present more advancedresources for the images reconstruction (multiplanarreconstruction – MPR), maximum intensity projection (MIP), andeven high quality 3D images with the volume rendering technology(VRT). Also, there is the possibility of utilizing differentmathematical algorithms, which are calculations performed by thetomograph computer in the moment of the images reconstruction,sharpening or softening them. These algorithms or filters have adirect influence on the images quality, changing both the spatialresolution and noise(3). Usually, in spine studies, a filter is utilized forvisualizing bone, and other for visualizing soft tissues, onaxial, sagittal and coronal views. However, for evaluatingarthrodesis with metal implants, more detailed reconstructions,including 3D images, are necessary to reduce artifacts, and, forthis purpose, the utilization of different filters is involved.The recently produced Siemens CT equipment has several filtersspecific for each region of the body, with values ranging between10 and 90. The lower the filter value, the lower the noise andthe better the low-contrast resolution on the images, which areideal for visualizing soft tissues. When the filter value isincreased, there is an increase in the noise and spatialresolution on the image, ideal for visualizing bone structuresand high-contrast objects(3). The objective of the present study is to determine the most appropriate filters for lumbar spine CT evaluation after arthrodesis with metal implants.
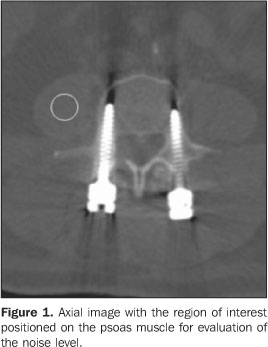
MATERIALS AND METHODS A multidetector (16 rows) CT equipment (Somatom Sensation Cardiac; Siemens AG) was utilized in the present study. Ten patients who had been submitted to CT of the lumbar-sacral spine for evaluation of arthrodesis with metal implant were selected. The examination was performed on a routine basis, under the following technical parameters: 120 kV, 200 mAs, reference and collimation 16 × 1,5 mm. An automatic exposure control system (Care Dose; Siemens AG) was utilized. Post-processing with filters numbers 20, 40, 60 e 80 was requested. After that, 3D reformation was performed with VRT in gray-scale and color, MPR with 2 mm and 4 mm thickness, axial, sagittal and coronal, oblique views, with specific inclinators for better demonstrating pedicle screws, in a post-processing workstation (Wizard; Siemens AG). Three hundred and twenty images were presented without acquisition and reconstruction parameters for evaluation by three experienced Radiologists who subjectively rated them from 1 to 5 (1 = unacceptable; 2 = substandard; 3 = acceptable; 4 = above the average; 5 = excellent) as to spatial resolution, noise and artifacts. Reconstruction criteria were the same for the whole sample, the filter being the only variable factor. Therefore, each patient was his/her own control, and it was not necessary to select patents with similar characteristics, with the same type of metal implant or biotype. Measurements of noise level were performed on axial images for each type of filter and slices thickness, positioning a region of interest on the psoas muscle (Figure 1).
Statistical analysis Grades and noise level measurements were included in a table and means and standard deviations were calculated. For determining the best types of filters for each type of reconstruction, a comparison between the averages of grades employing Friedman and Wilcoxon tests with Bonferroni correction. Interobserver concordance was analyzed with the kappa test.
RESULTS Patients' data are shown on Table 1. The mean noise levels for reconstruction with 2 mm thick slices and filters 20, 40, 60 and 80 were respectively de 24.7 ± 4.3, 35.5 ± 4.2, 106.0 ± 18.5 and 145.9 ± 26.9; and with 4 mm thick slices were 18.1 ± 2.4, 25.1 ± 4.6, 76.7 ± 17.2 and 106.6 ± 23.4. The graphic on Figure 2 shows this variation for each type of filter.
Table 2 shows means and standard deviations of the grades given by the three observers.
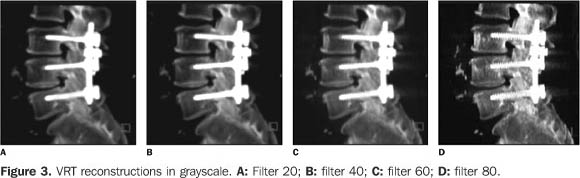
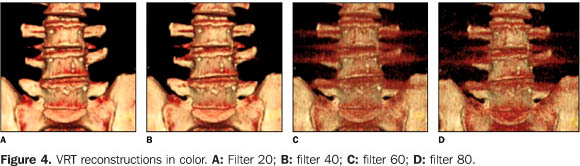
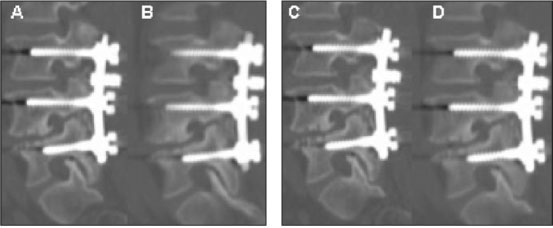
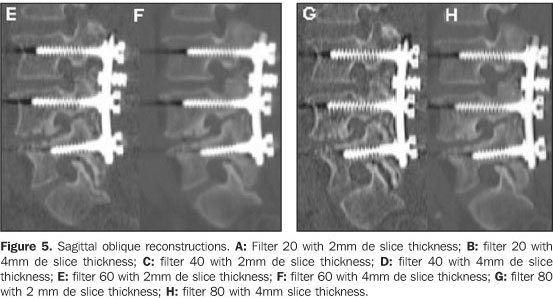
The statistical analysis has proved the existence of a difference in the images for the several types of filters and slices thickness (p < 0.05). For the VRT reconstruction in grayscale (Figure 3), the filter 60 presented the best mean, although being statistically similar to that of the filter 60. On color VRT images (Figure 4), the best mean was that of filter 20. On the 2 mm thick sagittal reconstruction (Figure 5 – A,C, E,G), the highest mean was that of filter 20, although statistically similar to that for the filter 40. For the 2 mm thick (Figure 6 A,C,E,G) and 4 mm thick (Figure 6 – B,D,F,H) axial reconstructions with filter 60, the highest means has been obtained. For 2 mm thick (Figure 7 – A,C,E,G) and 4 mm (Figure 7 – B,D,F,H) coronal images, the highest means were, respectively, those of filters 40 and 60.
With basis on the statistical analyses, interobserver concordance was observed in relation to the sagittal and coronal 2 mm VRT reconstructions in color (p < 0.05). For the other reconstructions, the concordance was low.
DISCUSSION The postoperative evaluation is aimed at assuring thediagnosis of the dural sac and nervous roots integrity; observingalignment and bone fixation, the metal material mechanics andintegration; verifying the previous disease correction degree;and identifying eventual complications like hematomas,inflammatory processes, etc. The utilization of an appropriate technique in the imagesreconstruction is extremely important, mainly in studiessusceptible to artifacts. In such cases, a complete eliminationof artifacts is practically impossible, however, they can bereduced to an acceptable level to not impairing the diagnosis.The CT in the evaluation of arthrodesis has been always veryproblematic(4) because of beam hardeningartifacts, but the introduction of the multidetector ormultislice CT has brought a new perspective for these studies.The quality of the volume rendering and images reconstructionresources has improved considerably in relation to the previoustechnologies(5). In the images acquisition process, the noise level is directlyrelated to the radiation dose, the collimation of detectors, andthe slice reconstruction thickness; on the other hand, thespatial resolution is influenced only by the collimation ofdetectors. In the reconstruction phase, filters or mathematicalalgorithms should be considered in addition to slice thickness,since the equipments allow an array of combinations betweenfilters and slice thicknesses. Based on the results of the present study, we could observethat lower filter values and greater slice thicknesses result ina decrease in the spatial resolution and noise reduction of thereconstructed images. A low noise level is highly favorable tocolor 3D reconstructions with the VRT technique, resulting inhigh quality images of the lumbar spine. In the analysis ofgrayscale images obtained with VRT which present a certaintransparency allowing the demonstration of the pedicle screws,the Radiologists gave higher grades for reconstructions withintermediate filters like 40 and 60. These results are justifiedby the higher spatial resolution allowing a better visualizationof grooves or alterations on pedicle screws. In the analysis ofMPR images, filter 20 and 80 received the lowest grades. The useof filter 20 results in a very low definition of borders and bonetrabeculations due the lower spatial resolution. The filter 80,on the contrary, accentuates borders and noises. On the otherhand, filters 40 and 60 had a better performance with slicethicknesses of 4 mm and 2 mm, respectively. As previouslymentioned, with lower slice thicknesses, there is an increase inspatial resolution and noise level, so the increase in noiselevel, as a result of a 2 mm slice thickness, is balanced by thefilter 40, and the decrease in spatial resolution resulting from4 mm slice thickness is balanced by the filter 60. Images were subjectively analyzed by the radiologists who havegiven higher grades to images gathering the most comprehensiveset of positive factors like a balance among spatial resolution,noise level and artifacts. In the daily practice, the protocolfor images acquisition and reconstruction must be adequatelystandardized to attain similar results in terms of images qualityfor every patient. The utilization of several combinations offilters and slice thicknesses is not recommended because of itsimpracticability, besides the high number of images generated.Therefore, a type of filter for color VRT images, and another forMPR are sufficient. The noise level increased gradually as the filters werechanged from 20 to 80. Also, the 2 mm slice thickness showed ahigher noise level in relation to the 4 mm slice thickness. Onthe whole, color 3D-VRT images are better visualized with filter20 because of the lower noise level, however, on grayscale VRTimages, an intermediary filter 40 or 60 might be of help todemonstrate pedicle screws in higher detail. In spite of thedisagreement of the physicians' opinions on MPR images, theconclusion is that, for a 2mm slice thickness the filter 40 isthe best for balancing the noise resulting from the slicethinness, and with a 4 mm slice thickness, a filter 60 results ina better quality of image. Acknowledgements Our thanks to the technicians and technologists in the sector of CT, and to the radiologists who have contributed for the success of this study.
REFERENCES 1. Williams AL, Gornet MF, Burkus JK. CT evaluation of lumbar interbody fusion: current concepts. AJNR Am J Neurorradiol 2005;26:2057–2066. [ ] 2. United Nations Scientific Committee on the Effects of Atomic Radiation. UNSCEAR 2000 Report to the General Assembly, with scientific annexes. Annex D. New York: United Nations, 2000. [ ] 3. Seeram E. Computed tomography. Physical principles, clinical applications, and quality control. 2nd ed. Philadelphia: WB Saunders, 2001. [ ] 4. Cook SD, Patron LP, Christa Kis PM, et al. Comparison of methods for determining the presence and extend of anterior lumbar interbody fusion. Spine 2004;29:1118–1123. [ ] 5. Cody DD, Moxley DM, Davros W, Silverman PM. Principles of multislice computed tomography technology. In: Silverman PM, editor. Multislice computed tomography. A practical approach to clinical protocols. 1st ed. Philadelphia: Lippincott Williams & Wilkins, 2002;1–29. [ ]
Received July 7, 2006.
* Study developed at Hospital Moinhos de Vento, Porto Alegre, RS, Brazil. |
|

Av. Paulista, 37 - 7° andar - Conj. 71 - CEP 01311-902 - São Paulo - SP - Brazil - Phone: (11) 3372-4544 - Fax: (11) 3372-4554