Radiologia Brasileira - Publicação Científica Oficial do Colégio Brasileiro de Radiologia
AMB - Associação Médica Brasileira CNA - Comissão Nacional de Acreditação
 Ahead of Print
|
REVIEW ARTICLE
|
|
Thoracic tomographic manifestations in symptomatic respiratory patients with COVID-19 |
|
|
Autho(rs): Lucas de Pádua Gomes de Fariasa; Daniel Giunchetti Strabellib; Eduardo Kaiser Ururahy Nunes Fonsecac; Bruna Melo Coelho Loureirod; Cesar Higa Nomurae; Márcio Valente Yamada Sawamuraf |
|
|
Keywords: Coronavirus; COVID-19; Multislice computed tomography. |
|
|
Abstract: INTRODUCTION
Initially, the respiratory infection caused by the novel coronavirus strain SARS-CoV-2, which was first detected in the city of Wuhan (Hubei province, China) in December 2019, was reported as a pneumonia of unknown etiology. Since then, it has been named coronavirus disease 2019 (COVID-19) and has rapidly spread worldwide. On March 11, 2020, the World Health Organization declared COVID-19 as a pandemic(1,2). Reportedly, the tomographic findings of pneumonia caused by COVID-19 are nonspecific and similar to those induced by other viral infections, such as influenza, COVID-19 triggers pneumonia, drug-induced pneumonitis, and connective tissue diseases(3). Computed tomography (CT), although recognized as an extremely sensitive method, has not been indicated as the first diagnostic approach by several radiology societies, restricting its utility for specific cases such as hospitalized and symptomatic patients or in specific clinical situations(36). The reference diagnosis is based on reverse transcription polymerase chain reaction (RT-PCR) and a dissociation between laboratory and tomographic findings may be present even in initially symptomatic patients(3,7,8). Chest radiography has limited efficiency due to its low sensitivity and specificity, demonstrating normal or ambiguous findings in most initial cases (Figure 1); as such, clinicians and radiologists need to be aware of these limitations(4,9). However, it can be used at bedside and in field hospitals. In contrast, ultrasonography can be used to monitor patients, especially those in intensive care units, as it can identify peripheral changes in the lung, the region most affected by the virus(10). 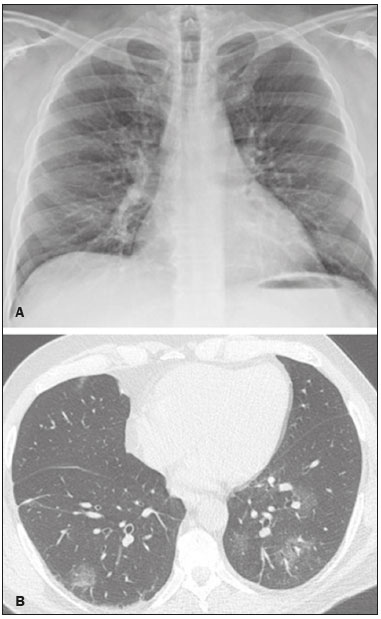 Figure 1. Male patient, 35 years old. Posteroanterior chest radiography (A) showing no pulmonary changes. MDCT (B) on the same day shows opacities with ground-glass attenuation in the lower lobes. Positive RT-PCR for SARS-CoV-2. The objective of this study was to present the most significant imaging results obtained from symptomatic respiratory patients with COVID-19 using a multidetector CT (MDCT). These findings were described according to the Brazilian consensus on the terminology of key descriptors and standards(11). PULMONARY MANIFESTATIONS Parenchymal changes induced by the novel coronavirus are possibly related to its affinity for the angiotensinconverting enzyme 2(12), which is highly expressed in the lungs and heart, allowing the virus to invade alveolar epithelial cells and resulting in cell damage and local inflammatory responses that lead to respiratory symptoms(13). Postmortem histopathological examinations have demonstrated diffuse alveolar damage with fibromyxoid exudates, characterized by pulmonary edema with hyaline membrane-formation and pneumocyte desquamation, which indicate an early phase of acute respiratory distress, suggesting that this is the pathological process underlying the tomographic findings of alveolar and interstitial damage and parenchymal changes(14). Initially, CT scans may fail to detect changes or indicate only small areas of ground-glass opacity, which are sometimes isolated. Over time, the number and extent of pulmonary findings increase, mainly with consolidations and crazy-paving areas. These findings usually peak around the 10th day and slowly regress. In the late stages, linear opacities are commonly observed, although ground-glass opacities and consolidations may persist(15). Ground-glass pattern A ground-glass pattern is defined as an increased density of the pulmonary parenchyma that does not obscure the bronchial and vascular structures within the area affected by the pathological process. Additionally, it may be related to interstitial thickening, partial air space filling, partial alveoli collapse, increased capillary blood volume, or an association with any of these factors(11). Ground-glass opacities in patients with COVID-19 pneumonia tend to be multi- and bilateral, predominantly peripheral, mainly posterior and with a slight predominance in the middle and lower pulmonary fields (Figures 1 and 2), indicated as the most frequent initial signs in most cases(7,1517). Although literature describes a variable incidence of ground-glass opacities, it is considered an usual finding, ranging between 86% and 100% in some studies(15,18,19). 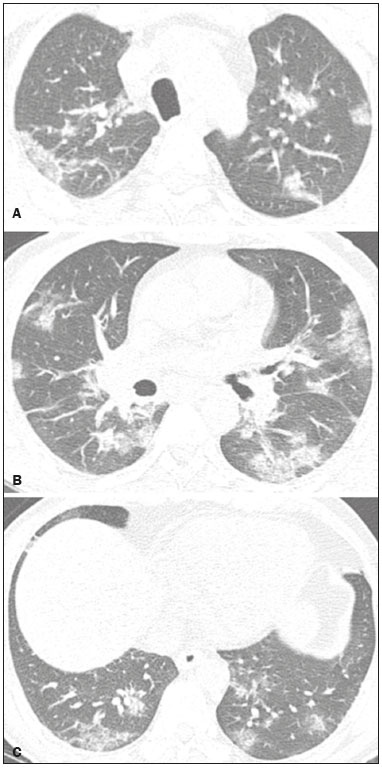 Figure 2. Male patient, 48 years old. MDCT shows ground-glass opacities and diffuse consolidation foci in the upper (A), middle (B), and lower (C) lung fields with predominantly peripheral distribution in the posterior regions. Positive RTPCR for SARS-CoV-2. Consolidation Consolidation refers to the replacement of air in the alveolar space by cells, tissues, or pathological fluids, obscuring the local vessels and bronchial margins, sometimes forming air bronchograms(11). In COVID-19, consolidations are often associated with ground-glass opacities with a similar distribution pattern(16,17,20)(Figure 2). Consolidations tend to appear later, indicating the organized pathophysiological disease process, and are frequently observed after the onset of reticular opacities and crazy-paving patterns(15,17). They are found to occur in 31.8% to 41% of cases(16,17); however, this incidence varies, especially when evaluated together with ground-glass and/or reticular opacities(15,18). Reticular pattern Usually associated with interstitial diseases, reticular patterns demonstrate the thickening of interlobular and intralobular septa, presenting as linear opacities on tomography(11). This is not a common finding in the initial presentations of COVID-19 and is observed in less than 22% cases(15,19), usually in later stages of the disease and preferentially in the periphery of the lungs(7,17,20)(Figure 3A). Conversely, 20% of patients with pneumonia caused by the novel coronavirus have been reported to exhibit sub-pleural lines, which are nonspecific indicators of atelectasis, edema, fibrosis, or inflammation, characterized by subpleural curvilinear opacities parallel to its surface(11,18)(Figure 3B). 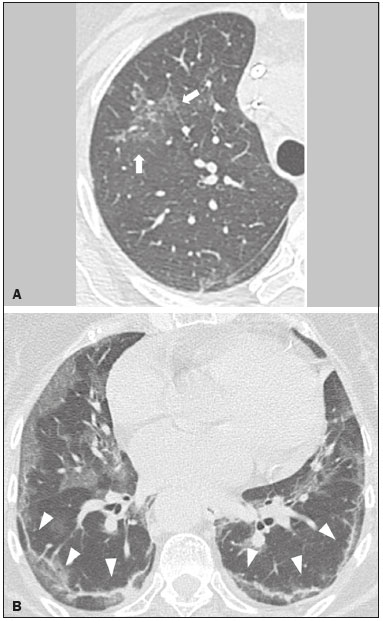 Figure 3. Female patients, 51 (A) and 68 years old (B). MDCT shows reticular opacities (arrows) in the anterior segment of the right upper lobe and bilateral subpleural curvilinear lines (arrowheads) in the lower lobes. Additionally, other multifocal opacities with ground-glass attenuation are present. Positive RT-PCR for SARS-CoV-2 in both patients. Crazy-paving Crazy-paving indicates the overlapping of ground-glass opacities and thickening of interlobular and intralobular septa, with a well-defined interface between adjacent normal lung parenchyma, indicating alveolar and interstitial involvement(11). Tomographic identification suggests disease progression or even a peak stage, observed in 53% of cases(15); however, it is not common during resolution phases(15,17) (Figure 4). 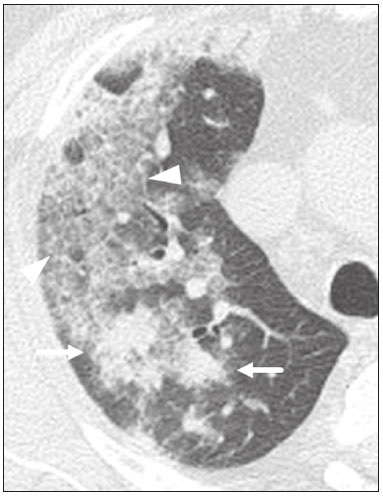 Figure 4. Male patient, 59 years old. MDCT shows ground-glass opacity in the right lung associated with interlobular and intralobular septal thickening, characterized by the crazy-paving pattern (arrowheads) and some consolidation foci (arrows). Positive RT-PCR for SARS-CoV-2. Reversed halo sign This indicates a ground-glass opacity that is partially or completely surrounded by a consolidation ring(11), which may represent stages of disease progression with a pattern of organizing pneumonia(9,17,21); it has been observed in up to 8% of cases(19)(Figure 5). 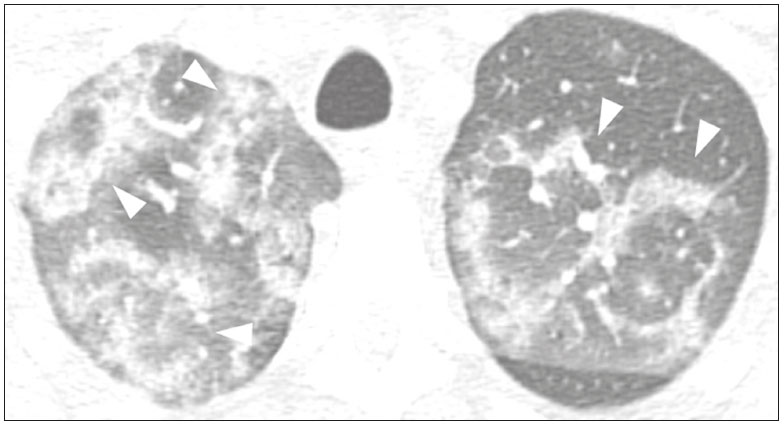 Figure 5. Male patient, 56 years old. MDCT shows ground-glass attenuation opacities, partially or surrounded by a consolidation ring, characterized by the reversed halo sign (arrowheads) in both lungs. Positive RT-PCR for SARS-CoV-2. Nodule Nodules are defined as rounded focal opacities measuring less than 3 cm, with or without calcifications that can be solid, partially solid, or only presenting ground-glass attenuation(11). These can be observed in viral pneumonia and have been reported in 313% of COVID-19 pneumonia cases(8,18,22), with some demonstrating a surrounding ground-glass zone that forms the halo sign(8,23,24). Parenchymal band The parenchymal band is described as a peripheral linear opacity, perpendicular or oblique to the pleural surface, which may be thickened or retracted at the contact site. Furthermore, it is usually associated with pleural parenchymal fibrosis(11) and occurs more frequently during advanced stages of the disease compared to initial stages(7) (Figure 6). Although some studies suggest that fibrotic streaks may appear during the resolution of parenchymal aggression, with inflammatory cells replaced by fibrous tissue, other studies report that it is a sign of poor prognosis, with progression to fibrous interstitial disease(8,15,22). 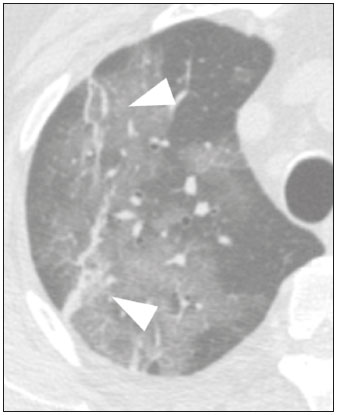 Figure 6. Male patient, 70 years old. MDCT shows parenchymal bands/fibroatelectatic band opacities on the pulmonary periphery. Additionally, other opacities with ground-glass attenuation are observed. Positive RT-PCR for SARS-CoV-2. Pseudo-cavity The pseudo-cavity represents an area less than 1 cm in diameter and has a low attenuation coefficient inside pulmonary nodules/masses or consolidations(11). In cases of pneumonia caused by the novel coronavirus, pseudocavity may represent a pathological airspace dilation, cross-sectional bronchiectasis, or a consolidation area during the resorption process(21)(Figure 7). It is important to establish a differential diagnosis with cavitary lesions (cavities/excavations), which are atypical and infrequent injuries in COVID-19 pneumonia. Furthermore, associated complications such as overlapping secondary infections and alternative diagnoses should be considered(3,16,17,25). 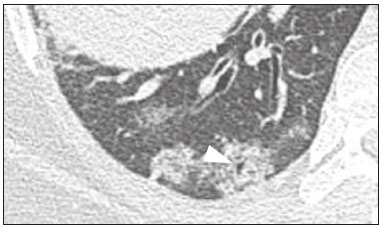 Figure 7. Male patient, 41 years old. MDCT shows pseudo-cavity associated with consolidation and ground-glass opacity on the right lower lobe (arrowhead). Positive RT-PCR for SARS-CoV-2. Vascular ectasia Vascular ectasia is usually represented by the dilation of pulmonary vessels inside or adjacent to a lesion due to damage and capillary edema caused by the activity of local inflammatory factors(18) (Figure 8). 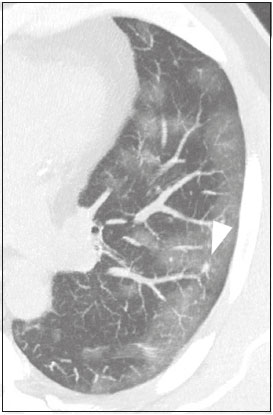 Figure 8. Male patient, 44 years old. Axial MDCT image with maximum intensity projection reconstruction shows extensive peripheral opacity with groundglass attenuation and some ectatic vessels inside (arrowhead). Positive RTPCR for SARS-CoV-2. PLEURAL MANIFESTATIONS Pleural changes are less frequent(17,25), especially during the initial stages. However, pleural thickening, effusion (Figure 9), and retraction can occur during the disease(16,20). The presence of pleural effusion suggests overlapping infection or alternative diagnoses(8). 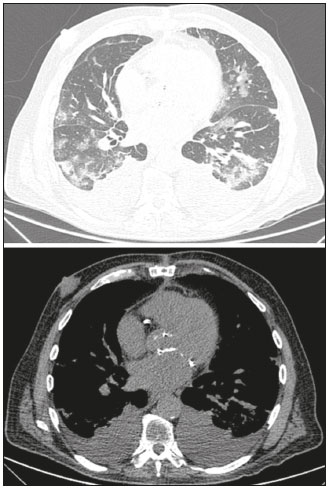 Figure 9. Male patient, 69 years old. MDCT shows diffuse ground-glass opacity in both lungs and consolidation foci associated with a minor bilateral pleural effusion, indicating restrictive atelectasis of the adjacent lung parenchyma. Positive RT-PCR for SARS-CoV-2. AIRWAY MANIFESTATIONS Airway changes, including bronchial wall thickening and centrilobular micronodules and with tree-in-bud, remain infrequent. The most observed sign is an air bronchogram (Figure 10), identified between ground-glass opacities or consolidations. Peribronchial inflammatory changes, represented by parietal or peribronchovascular interstitial thickening, can retract the walls with consequent distortion and ectasia(20) (Figure 10). 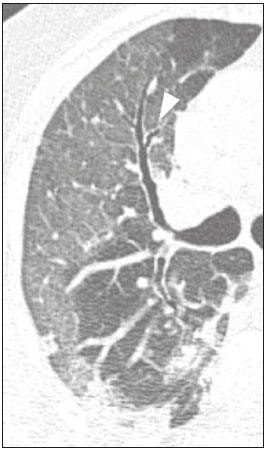 Figure 10. Female patient, 76 years old. MDCT shows air bronchogram between opacity with ground-glass attenuation and some consolidation foci associated with bronchial wall thickening and distortion (arrowhead). Positive RT-PCR for SARS-CoV-2. CARDIOVASCULAR AND MEDIASTINAL MANIFESTATIONS Cardiovascular complications including myocarditis, acute myocardial infarction, and exacerbation of heart failure are associated with comorbidities and other complications; such complications have been well recognized in historical viral epidemics, such as influenza and previous coronavirus outbreaks(13,26), due to the mechanism of angiotensin-converting enzyme 2 and the intense cytokine production by T helper lymphocytes types 1 and 2(13). The consequences of cardiac symptoms can be intensified by acute respiratory distress syndrome, as well as by mechanical ventilation with hemodynamic implications. In cases of limited availability or use of echocardiogram and/or cardiac magnetic resonance, contrasted-enhanced chest CT, even if not coupled with the electrocardiogram, can provide information regarding the diameter of cardiac chambers as well as pericardial changes. The dimensions of the cardiac chambers can be estimated using the evaluation proposed by Hota et al.(27)(Figure 11). The pericardial effusion volume can be estimated using the evaluation proposed by Ivens et al.(28)(Figure 11), which considers a normal pericardial thickness of up to 2 mm. 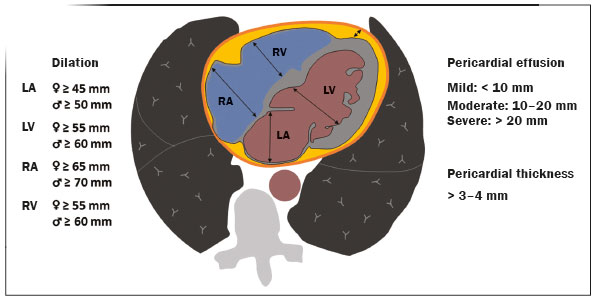 Figure 11. Illustrative scheme to measure the cardiac chambers and estimate the volume of pericardial effusion/thickening in chest tomography not coupled to an electrocardiogram. The left atrium (LA) must be measured in the anteroposterior diameter while the other cardiac chambers must be measured in the transverse diameter(27,28). Pericardial effusion and mediastinal lymph node enlargement (diameter greater than 1 cm in its shortest axis) are uncommon findings during the initial stages of COVID-19(15,17,25); however, when present, they both suggest a more severe disease state(29). CONCLUSION Recent studies have suggested that chest CT has greater sensitivity but low specifi city when compared to RT-PCR for the diagnosis of COVID-19(1,8,30,31; however, a diagnostic confi rmation with the viral test is necessary for etiological diagnosis, even with typical radiological fi ndings(4). The use of CT to evaluate patients with suspected COVID-19 has been increasingly considered, although most professional societies do not recommend its use as a screening method(36). The predominant typical radiological fi ndings include peripheral and bilateral multilobe and bilateral ground-glass opacities, with or without septal consolidation, round opacities with ground-glass attenuation with or without consolidation foci or septal thickening, or the reverted halo sign (or other fi ndings of organizing pneumonia). When these imaging patterns are not present, chest CT scans can still be categorized as indeterminate, atypical, or negative for pneumonia, highlighting that some tests demonstrate no radiological changes during the earlier stages of the disease(3). REFERENCES 1. Zhu N, Zhang D, Wang W, et al. A novel coronavirus from patients with pneumonia in China, 2019. N Engl J Med. 2020;382:72733. 2. World Health Organization. WHO Director-Generals opening remarks at the media briefing on COVID-19 - 11 March 2020. [updated 2020 Mar 11; cited 2020 Mar 23]. Available from: https://www.who.int/dg/speeches/detail/who-director-general-s-openingremarks-at-the-media-briefing-on-covid-19---11-march-2020. 3. Simpson S, Kay FU, Abbara S, et al. Radiological Society of North America Expert Consensus Statement on Reporting Chest CT Findings Related to COVID-19. Endorsed by the Society of Thoracic Radiology, the American College of Radiology, and RSNA. Radiology: Cardiothoracic Imaging. 2020;2(2). 4. American College of Radiology. ACR Recommendations for the use of chest radiography and computed tomography (CT) for suspected COVID-19 infection. [updated 2020 Mar 22; cited 2020 Mar 23]. Available from: https://www.acr.org/Advocacy-and-Economics/ACR-Position-Statements/Recommendations-for-Chest-Radiography-and-CT-for-Suspected-COVID19-Infection. 5. Colégio Brasileiro de Radiologia e Diagnóstico por Imagem. Recomendações de uso de métodos de imagem para pacientes suspeitos de infecção pelo COVID-19. [cited 2020 Mar 23]. Available from: https://cbr.org.br/wp-content/uploads/2020/03/CBR_Recomendações-de-uso-de-métodos-de-imagem_16-03-2020.pdf. 6. Society of Thoracic Radiology. STR/ASER COVID-19 Position Statement March 11, 2020. [updated 2020 Mar 11; cited 2020 Mar 23]. Available from: https://thoracicrad.org. 7. Araujo Filho JAB, Sawamura MVY, Costa AN, et al. Pneumonia por COVID-19: qual o papel da imagem no diagnóstico? J Bras Pneumol. 2020;46(2). [Epub Mar 27, 2020]. 8. Kanne JP, Little BP, Chung JH, et al. Essentials for radiologists on COVID-19: an update-Radiology Scientific Expert Panel. Radiology. 2020:200527. [Epub ahead of print]. 9. Yoon SH, Lee KH, Kim JY, et al. Chest radiographic and CT findings of the 2019 novel coronavirus disease (COVID-19): analysis of nine patients treated in Korea. Korean J Radiol. 2020;21:494500. 10. Soldati G, Smargiassi A, Inchingolo R, et al. Is there a role for lung ultrasound during the COVID‐19 pandemic? J Ultrasound Med. 2020. [Epun ahead of print]. 11. Silva CIS, Marchiori E, Souza Júnior AS, et al. Consenso brasileiro ilustrado sobre a terminologia dos descritores e padrões fundamentais da TC de tórax. J Bras Pneumol. 2010;36:99123. 12. Xu X, Chen P, Wang J, et al. Evolution of the novel coronavirus from the ongoing Wuhan outbreak and modeling of its spike protein for risk of human transmission. Sci China Life Sci. 2020;63:45760. 13. Zheng YY, Ma YT, Zhang JY, et al. COVID-19 and the cardiovascular system. Nat Rev Cardiol. 2020;17:25960. 14. Xu Z, Shi L, Wang Y, et al. Pathological findings of COVID-19 associated with acute respiratory distress syndrome. Lancet Respir Med. 2020;8:4202. 15. Pan F, Ye T, Sun P, et al. Time course of lung changes on chest CT during recovery from 2019 novel coronavirus (COVID-19) pneumonia. Radiology. 2020; 200370. [Epub ahead of print]. 16. Salehi S, Abedi A, Balakrishnan S, et al. Coronavirus disease 2019 (COVID-19): a systematic review of imaging findings in 919 patients. AJR Am J Roentgenol. 2020 Mar 14:17. [Epub ahead of print]. 17. Bernheim A, Mei X, Huang M, et al. Chest CT findings in coronavirus disease-19 (COVID-19): relationship to duration of infection. Radiology. 2020:200463. [Epub ahead of print]. 18. Ye Z, Zhang Y, Wang Y, et al. Chest CT manifestations of new coronavirus disease 2019 (COVID-19): a pictorial review. Eur Radiol. 2020 Mar 19. [Epub ahead of print]. 19. Chate RC, Fonseca EKUN, Passos RBD, et al. Apresentação tomográfica da infecção pulmonar na COVID-19: experiência brasileira inicial. J Bras Pneumol. 2020;46(2). [Epub Apr 09, 2020]. 20. Zhou S, Wang Y, Zhu T, et al. CT features of coronavirus disease 2019 (COVID-19) pneumonia in 62 patients in Wuhan, China. AJR Am J Roentgenol. 2020;Mar 5:18. [Epub ahead of print]. 21. Farias LPG, Strabelli DG, Sawamura MVY. Pneumonia por COVID- 19 e o sinal do halo invertido. J Bras Pneumol. 2020;46(2). [Epub Apr 22, 2020]. 22. Pan Y, Guan H, Zhou S, et al. Initial CT findings and temporal changes in patients with the novel coronavirus pneumonia (2019- nCoV): a study of 63 patients in Wuhan, China. Eur Radiol. 2020 Feb 13. [Epub ahead of print]. 23. Li X, Zeng X, Liu B, et al. COVID-19 infection presenting with CT halo sign. Radiology: Cardiothoracic Imaging. 2020 Feb 12;2(1). 24. Farias LP, Pereira HA, Anastacio EP, et al. O sinal do halo como apresentação tomográfica pulmonar na COVID-19. Einstein (São Paulo). 2020;18:eAI5742. 25. Ng MY, Lee EYP, Yang J, et al. Imaging profile of the COVID-19 infection: radiologic findings and literature review. Radiology: Cardiothoracic Imaging. 2020 Feb 13;2(1). 26. Xiong TY, Redwood S, Prendergast B, et al. Coronaviruses and the cardiovascular system: acute and long-term implications. Eur Heart J. 2020; pii: ehaa231. 27. Hota P, Simpson S. Going beyond cardiomegaly: evaluation of cardiac chamber enlargement at non-electrocardiographically gated multidetector CT: current techniques, limitations, and clinical implications. Radiology: Cardiothoracic Imaging. 2019 Apr 25;1(1). 28. Ivens EL, Munt BI, Moss RR. Pericardial disease: what the general cardiologist needs to know. Heart. 2007;93:9931000. 29. Li K, Wu J, Wu F, et al. The clinical and chest CT features associated with severe and critical COVID-19 pneumonia. Invest Radiol. 2020 Feb 29. [Epub ahead of print]. 30. Fang Y, Zhang H, Xie J, et al. Sensitivity of chest CT for COVID-19: comparison to RT-PCR. Radiology. 2020:200432. [Epub ahead of print]. 31. Ai T, Yang Z, Hou H et al. Correlation of chest CT and RT-PCR testing for coronavirus disease 2019 (COVID-19) in China: a report of 1014 cases. Radiology. 2020:200642. [Epub ahead of print]. Instituto de Radiologia do Hospital das Clínicas da Faculdade de Medicina da Universidade de São Paulo (InRad/HC-FMUSP), São Paulo, SP, Brazil a. https://orcid.org/0000-0001-5195-9818 b. https://orcid.org/0000-0002-0526-5775 c. https://orcid.org/0000-0002-0233-0041 d. https://orcid.org/0000-0002-7270-2664 e. https://orcid.org/0000-0002-7131-6614 f. https://orcid.org/0000-0002-9424-9776 Correspondence: Dr. Lucas de Pádua Gomes de Farias Instituto de Radiologia HC-FMUSP Rua Doutor Ovídio Pires de Campos, 75, Cerqueira César São Paulo, SP, Brazil, 05403-010 Email: lucas.padua@hc.fm.usp.br Received 31 March 2020 Accepted after revision 23 April 2020 Publication date: 07/05/2020 |
|
Av. Paulista, 37 - 7° andar - Conj. 71 - CEP 01311-902 - São Paulo - SP - Brazil - Phone: (11) 3372-4544 - Fax: (11) 3372-4554